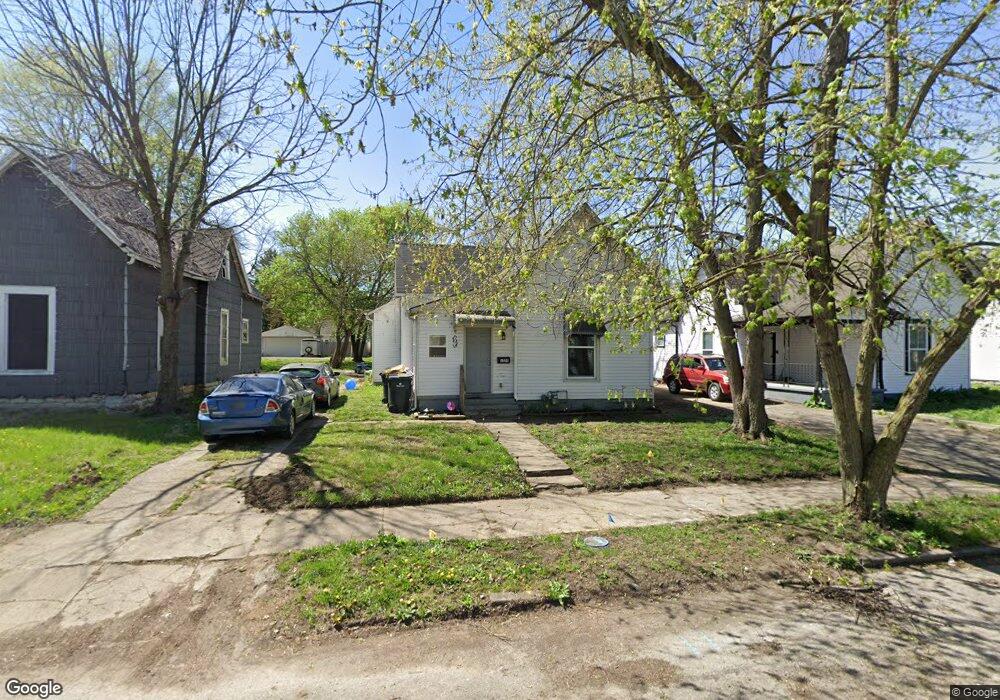
1029 W 6th St Anderson, IN 46016
Estimated Value: $84,000 - $120,000
3
Beds
1
Bath
1,688
Sq Ft
$62/Sq Ft
Est. Value
About This Home
This home is located at 1029 W 6th St, Anderson, IN 46016 and is currently estimated at $104,209, approximately $61 per square foot. 1029 W 6th St is a home located in Madison County with nearby schools including Eastside Elementary School, Highland Middle School, and Anderson High School.
Ownership History
Date
Name
Owned For
Owner Type
Purchase Details
Closed on
Sep 26, 2022
Sold by
Btec Properties Llc
Bought by
Anderson 1019 Properties Llc
Current Estimated Value
Purchase Details
Closed on
Jan 31, 2020
Sold by
Chambers Bruce L
Bought by
Chambers Todd D and Chambers Eric R
Purchase Details
Closed on
Oct 7, 2019
Sold by
Big Head Industry Llc
Bought by
Btec Properties Llc
Purchase Details
Closed on
Jul 11, 2017
Sold by
Indiana Sell Now Llc
Bought by
Everybody Wins Llc
Purchase Details
Closed on
Jun 28, 2017
Sold by
Montgomery Dean E
Bought by
Indiana Sell Now Llc
Purchase Details
Closed on
Aug 8, 2006
Sold by
Penny Foerclosures Iii Llc
Bought by
Montgomery Dean E
Purchase Details
Closed on
Aug 2, 2006
Sold by
American General Financial Inc
Bought by
Penny Foreclosures Iii Llc
Purchase Details
Closed on
Dec 9, 2005
Sold by
Harris John E and Harris Linda L
Bought by
American General Financial Services Inc
Create a Home Valuation Report for This Property
The Home Valuation Report is an in-depth analysis detailing your home's value as well as a comparison with similar homes in the area
Home Values in the Area
Average Home Value in this Area
Purchase History
| Date | Buyer | Sale Price | Title Company |
|---|---|---|---|
| Anderson 1019 Properties Llc | -- | -- | |
| Chambers Todd D | -- | None Available | |
| Btec Properties Llc | -- | None Available | |
| Everybody Wins Llc | -- | -- | |
| Indiana Sell Now Llc | -- | -- | |
| Montgomery Dean E | -- | -- | |
| Penny Foreclosures Iii Llc | -- | -- | |
| American General Financial Services Inc | $25,000 | -- |
Source: Public Records
Tax History Compared to Growth
Tax History
| Year | Tax Paid | Tax Assessment Tax Assessment Total Assessment is a certain percentage of the fair market value that is determined by local assessors to be the total taxable value of land and additions on the property. | Land | Improvement |
|---|---|---|---|---|
| 2024 | $773 | $34,800 | $6,800 | $28,000 |
| 2023 | $716 | $32,000 | $6,500 | $25,500 |
| 2022 | $716 | $32,000 | $6,200 | $25,800 |
| 2021 | $664 | $29,500 | $6,100 | $23,400 |
| 2020 | $483 | $21,400 | $5,900 | $15,500 |
| 2019 | $475 | $21,000 | $5,900 | $15,100 |
| 2018 | $452 | $19,600 | $5,900 | $13,700 |
| 2017 | $388 | $19,400 | $5,900 | $13,500 |
| 2016 | $398 | $19,400 | $5,900 | $13,500 |
| 2014 | $402 | $20,100 | $5,800 | $14,300 |
| 2013 | $402 | $20,100 | $5,800 | $14,300 |
Source: Public Records
Map
Nearby Homes
- 1025 W 6th St
- 1103 W 6th St
- 1107 W 6th St
- 1019 W 6th St
- 1109 W 6th St
- 1030 W 7th St
- 1026 W 7th St
- 1018 W 7th St
- 1104 W 7th St
- 607 S Madison Ave
- 1028 W 6th St
- 1108 W 6th St
- 1108 W 6th St Unit 2
- 609 S Madison Ave
- 1102 W 7th St
- 1102 W 6th St
- 1108 W 7th St
- 615 S Madison Ave
- 1020 W 6th St
- 601 S Madison Ave