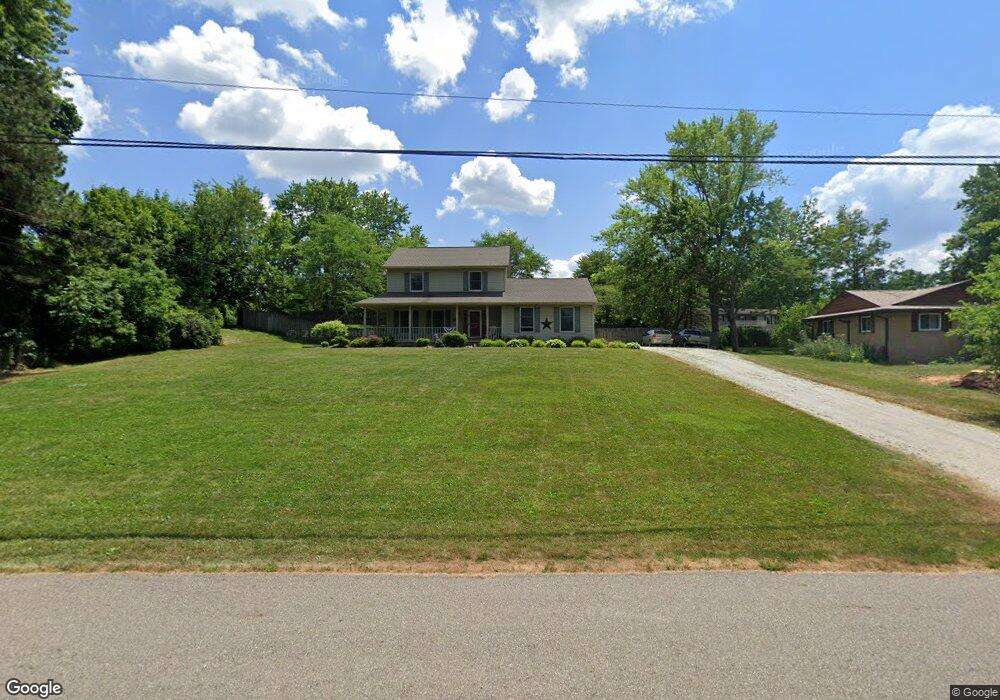
10290 Carlswood Ave NE Hartville, OH 44632
Estimated Value: $319,000 - $362,000
3
Beds
3
Baths
1,804
Sq Ft
$187/Sq Ft
Est. Value
About This Home
This home is located at 10290 Carlswood Ave NE, Hartville, OH 44632 and is currently estimated at $338,125, approximately $187 per square foot. 10290 Carlswood Ave NE is a home located in Stark County with nearby schools including Lake Middle/High School.
Ownership History
Date
Name
Owned For
Owner Type
Purchase Details
Closed on
Dec 28, 2000
Sold by
Karakis Nicholas M and Karakis Kimberly S
Bought by
Estep Mark and Estep Gail
Current Estimated Value
Home Financials for this Owner
Home Financials are based on the most recent Mortgage that was taken out on this home.
Original Mortgage
$114,400
Outstanding Balance
$43,005
Interest Rate
7.8%
Mortgage Type
Purchase Money Mortgage
Estimated Equity
$295,120
Purchase Details
Closed on
Feb 14, 1997
Sold by
Dave Yoder Builder Inc
Bought by
Karakis Nicholas M and Karakis Kimberly
Home Financials for this Owner
Home Financials are based on the most recent Mortgage that was taken out on this home.
Original Mortgage
$112,300
Interest Rate
7.25%
Mortgage Type
New Conventional
Purchase Details
Closed on
Mar 22, 1996
Sold by
Parsons Jeffery
Bought by
Dave Yoder Builder Inc
Purchase Details
Closed on
Jul 15, 1994
Sold by
Schumacher Lumber Co
Bought by
Horning Ronald and Horning Kathy
Create a Home Valuation Report for This Property
The Home Valuation Report is an in-depth analysis detailing your home's value as well as a comparison with similar homes in the area
Home Values in the Area
Average Home Value in this Area
Purchase History
| Date | Buyer | Sale Price | Title Company |
|---|---|---|---|
| Estep Mark | $143,000 | Titleco Title Agency | |
| Karakis Nicholas M | $124,800 | -- | |
| Dave Yoder Builder Inc | $14,000 | -- | |
| Horning Ronald | $3,000 | -- |
Source: Public Records
Mortgage History
| Date | Status | Borrower | Loan Amount |
|---|---|---|---|
| Open | Estep Mark | $114,400 | |
| Closed | Karakis Nicholas M | $112,300 | |
| Closed | Estep Mark | $21,450 |
Source: Public Records
Tax History Compared to Growth
Tax History
| Year | Tax Paid | Tax Assessment Tax Assessment Total Assessment is a certain percentage of the fair market value that is determined by local assessors to be the total taxable value of land and additions on the property. | Land | Improvement |
|---|---|---|---|---|
| 2025 | -- | $107,870 | $27,090 | $80,780 |
| 2024 | -- | $107,870 | $27,090 | $80,780 |
| 2023 | $3,358 | $71,970 | $15,300 | $56,670 |
| 2022 | $3,369 | $71,970 | $15,300 | $56,670 |
| 2021 | $3,407 | $71,970 | $15,300 | $56,670 |
| 2020 | $3,227 | $61,120 | $13,200 | $47,920 |
| 2019 | $3,197 | $61,120 | $13,200 | $47,920 |
| 2018 | $3,199 | $61,120 | $13,200 | $47,920 |
| 2017 | $3,110 | $55,200 | $11,550 | $43,650 |
| 2016 | $3,115 | $55,200 | $11,550 | $43,650 |
| 2015 | $3,113 | $55,200 | $11,550 | $43,650 |
| 2014 | $834 | $52,290 | $10,920 | $41,370 |
| 2013 | $1,417 | $52,290 | $10,920 | $41,370 |
Source: Public Records
Map
Nearby Homes
- 10277 Carlswood Ave NE
- 2793 Rita St NE
- 2574 Kim St NE
- 10387 Middlebranch Ave NE
- 10299 Hunting Hills Ave NE
- 0 Hunting Hills Ave NE
- 3135 Nimishillen Church Rd NE
- 10226 Schlabach Ave NE
- 9393 Kent Ave NE
- 11121 Geib Ave NE
- 1873 State St NE
- 2231 Lovers Ln NE
- 1153 Tessa Trail Unit 1153
- 8994 Kent Ave NE
- 9790 Smithdale Ave NE
- 425 Tonawanda Trail SW
- 177 Woodbury Glen St
- 10277 Market Ave N
- 225 Seneca Trail SW
- 2315 Old Elm St NE
- 10276 Carlswood Ave NE
- 2731 Kim St NE
- 10301 Middlebranch Ave NE
- 10283 Middlebranch Ave NE
- 2735 Kim St NE
- 2707 Kim St NE
- 10289 Carlswood Ave NE
- 10236 Carlswood Ave NE
- 10255 Middlebranch Ave NE
- 10265 Carlswood Ave NE
- 10216 Carlswood Ave NE
- 10198 Carlswood Ave NE
- 10274 Wanda Cir NE
- 2728 Kim St NE
- 2732 Kim St NE
- 10341 Middlebranch Ave NE
- 10166 Carlswood Ave NE
- 10233 Carlswood Ave NE
- 10233 Carlswood Ave NE
- 10296 Wanda Cir NE