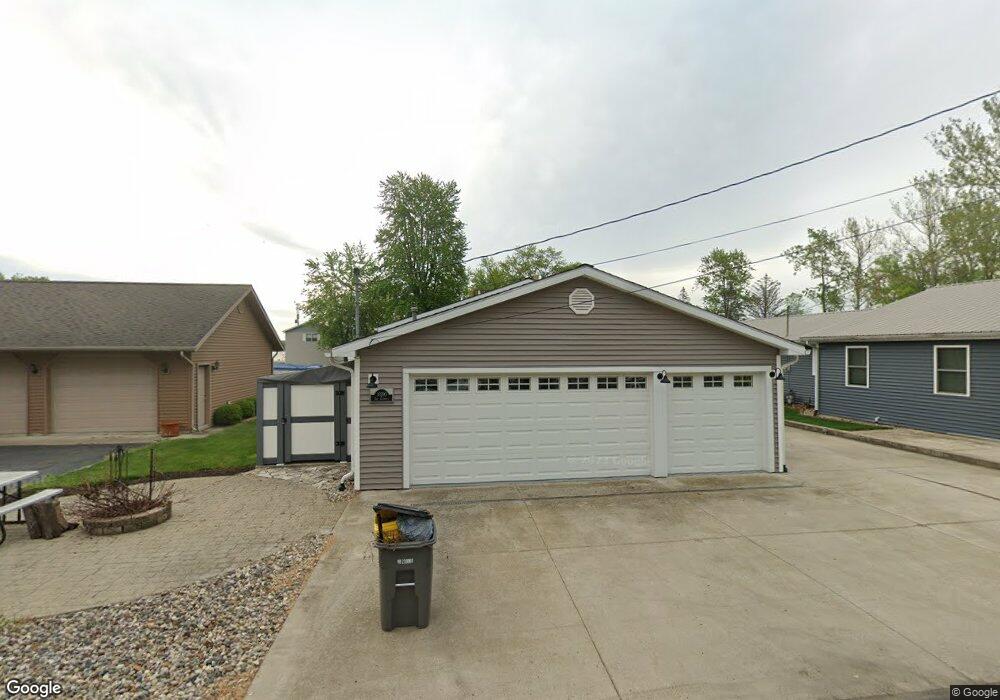
10290 N South Channel Dr Unit PIER 426-OJ Syracuse, IN 46567
Estimated Value: $472,000 - $628,000
2
Beds
2
Baths
1,184
Sq Ft
$434/Sq Ft
Est. Value
About This Home
This home is located at 10290 N South Channel Dr Unit PIER 426-OJ, Syracuse, IN 46567 and is currently estimated at $513,740, approximately $433 per square foot. 10290 N South Channel Dr Unit PIER 426-OJ is a home located in Kosciusko County with nearby schools including Wawasee High School.
Ownership History
Date
Name
Owned For
Owner Type
Purchase Details
Closed on
Jan 31, 2020
Sold by
Belcher Bradley S and Belcher Michelle R
Bought by
Giudice Brian K and Giudice Sallie H
Current Estimated Value
Home Financials for this Owner
Home Financials are based on the most recent Mortgage that was taken out on this home.
Original Mortgage
$256,000
Outstanding Balance
$227,100
Interest Rate
3.7%
Mortgage Type
New Conventional
Estimated Equity
$286,641
Purchase Details
Closed on
Apr 29, 2005
Sold by
Wright Denzie L
Bought by
Belcher Bradley S and Belcher Michelle R
Home Financials for this Owner
Home Financials are based on the most recent Mortgage that was taken out on this home.
Original Mortgage
$197,000
Interest Rate
6.06%
Mortgage Type
New Conventional
Purchase Details
Closed on
Aug 23, 1999
Sold by
Vale Willard D and Vale Darlene E
Bought by
Wright Denzie L and Wright Martha E
Create a Home Valuation Report for This Property
The Home Valuation Report is an in-depth analysis detailing your home's value as well as a comparison with similar homes in the area
Home Values in the Area
Average Home Value in this Area
Purchase History
| Date | Buyer | Sale Price | Title Company |
|---|---|---|---|
| Giudice Brian K | -- | Metropolitan Title Of In Llc | |
| Belcher Bradley S | -- | None Available | |
| Wright Denzie L | $165,200 | -- |
Source: Public Records
Mortgage History
| Date | Status | Borrower | Loan Amount |
|---|---|---|---|
| Open | Giudice Brian K | $256,000 | |
| Previous Owner | Belcher Bradley S | $197,000 |
Source: Public Records
Tax History Compared to Growth
Tax History
| Year | Tax Paid | Tax Assessment Tax Assessment Total Assessment is a certain percentage of the fair market value that is determined by local assessors to be the total taxable value of land and additions on the property. | Land | Improvement |
|---|---|---|---|---|
| 2024 | $3,597 | $403,600 | $183,800 | $219,800 |
| 2023 | $3,529 | $388,100 | $176,800 | $211,300 |
| 2022 | $3,117 | $340,500 | $161,200 | $179,300 |
| 2021 | $2,686 | $293,700 | $153,400 | $140,300 |
| 2020 | $2,309 | $272,700 | $148,200 | $124,500 |
| 2019 | $2,553 | $267,800 | $148,200 | $119,600 |
| 2018 | $2,369 | $260,300 | $148,200 | $112,100 |
| 2017 | $2,278 | $244,900 | $141,300 | $103,600 |
| 2016 | $1,986 | $244,900 | $141,300 | $103,600 |
| 2014 | $2,121 | $236,900 | $141,300 | $95,600 |
| 2013 | $2,121 | $244,600 | $145,000 | $99,600 |
Source: Public Records
Map
Nearby Homes
- 10492 N Elwood Ave
- 10454 N 800 E
- 9867 N Happiness Dr
- 9723 N Marine Key Dr
- 8629 E Hatchery Rd
- 10660 N Southshore Dr Unit D1
- 10660 N Southshore Dr Unit D3
- 10712 N Southshore Dr
- 8652 E Koher Rd S
- 8917 E Circle Dr S
- 9061 E Hatchery Rd
- 11425 N Cedar Point High Rd
- 11227 N East Wawasee Dr
- 9565 E Wawasee Ln
- 9246 E Koher Rd S
- 9207 N Koher Rd E
- 11900 N Rumpelstiltzkin Dr
- 11994 N Morris Rd
- 8217 E Constitution Dr
- 6458 E Waco Dr
- 10290 N South Channel Dr
- 10280 N South Channel Dr
- 10300 N South Channel Dr
- 0 S Channel Dr Unit 516164
- 10272 N South Channel Dr
- 10289 N South Channel Dr
- 10260 N South Channel Dr Unit PIER 426-OG
- 10260 N South Channel Dr
- 10310 N South Channel Dr
- 10299 N South Channel Dr
- 10299 S North Channel Dr
- 10273 N South Channel Dr
- 10293 N Beach Rd
- 10275 N Beach Rd
- 10317 N South Channel Dr
- 10259 N South Channel Dr
- TBD NE Beach Rd
- TBD N Beach Rd
- TBD Beach Rd
- TBD N Beach Rd Unit WAWASEE CHANNEL FRON