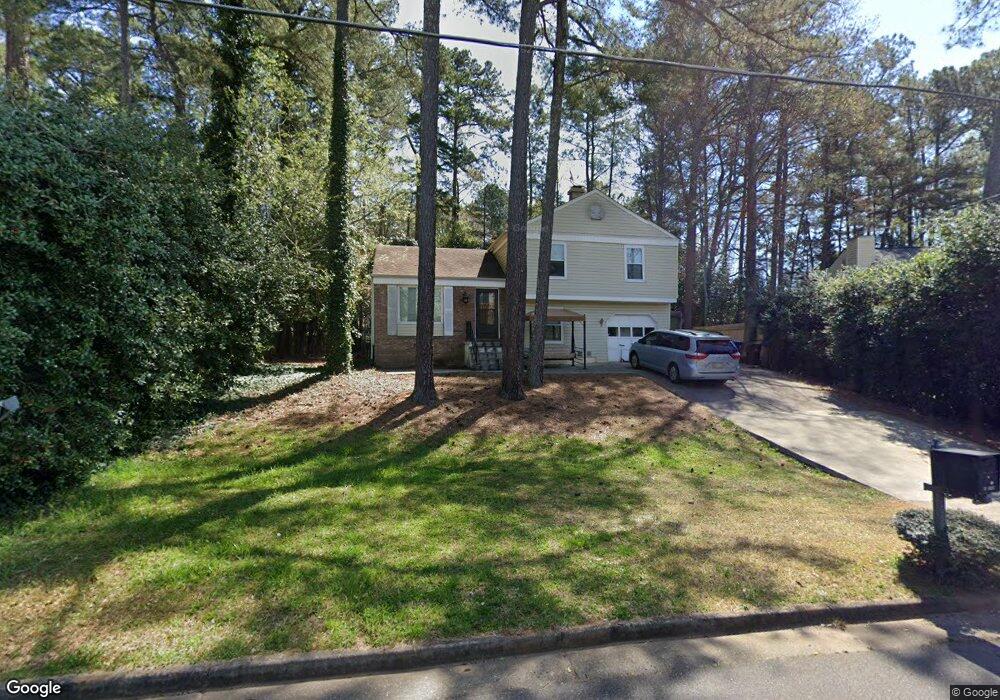
10295 Rillridge Ct Unit 2 Alpharetta, GA 30022
Estimated Value: $359,000 - $379,000
3
Beds
2
Baths
1,056
Sq Ft
$351/Sq Ft
Est. Value
About This Home
This home is located at 10295 Rillridge Ct Unit 2, Alpharetta, GA 30022 and is currently estimated at $370,724, approximately $351 per square foot. 10295 Rillridge Ct Unit 2 is a home located in Fulton County with nearby schools including Northwood Elementary School, Haynes Bridge Middle School, and Centennial High School.
Ownership History
Date
Name
Owned For
Owner Type
Purchase Details
Closed on
May 18, 2023
Sold by
Anghel Ioan Dan
Bought by
Anghel Rahela
Current Estimated Value
Purchase Details
Closed on
Nov 24, 2014
Sold by
Sirb Marius C
Bought by
Anghel Rahela and Anghel Loan Dan
Home Financials for this Owner
Home Financials are based on the most recent Mortgage that was taken out on this home.
Original Mortgage
$137,750
Interest Rate
3.15%
Mortgage Type
New Conventional
Purchase Details
Closed on
Jun 24, 1999
Sold by
Smead Stephen A and Smead Charlene J
Bought by
Sirb Marius C
Home Financials for this Owner
Home Financials are based on the most recent Mortgage that was taken out on this home.
Original Mortgage
$94,160
Interest Rate
7.13%
Mortgage Type
New Conventional
Create a Home Valuation Report for This Property
The Home Valuation Report is an in-depth analysis detailing your home's value as well as a comparison with similar homes in the area
Home Values in the Area
Average Home Value in this Area
Purchase History
| Date | Buyer | Sale Price | Title Company |
|---|---|---|---|
| Anghel Rahela | -- | -- | |
| Anghel Rahela | $145,000 | -- | |
| Sirb Marius C | $117,700 | -- |
Source: Public Records
Mortgage History
| Date | Status | Borrower | Loan Amount |
|---|---|---|---|
| Previous Owner | Anghel Rahela | $137,750 | |
| Previous Owner | Sirb Marius C | $94,160 |
Source: Public Records
Tax History Compared to Growth
Tax History
| Year | Tax Paid | Tax Assessment Tax Assessment Total Assessment is a certain percentage of the fair market value that is determined by local assessors to be the total taxable value of land and additions on the property. | Land | Improvement |
|---|---|---|---|---|
| 2025 | $718 | $132,560 | $33,240 | $99,320 |
| 2023 | $3,343 | $118,440 | $25,160 | $93,280 |
| 2022 | $2,864 | $108,840 | $25,720 | $83,120 |
| 2021 | $3,054 | $92,880 | $21,640 | $71,240 |
| 2020 | $2,894 | $86,280 | $19,400 | $66,880 |
| 2019 | $481 | $83,720 | $20,240 | $63,480 |
| 2018 | $1,829 | $64,800 | $13,520 | $51,280 |
| 2017 | $1,371 | $47,000 | $10,440 | $36,560 |
| 2016 | $1,372 | $47,000 | $10,440 | $36,560 |
| 2015 | $1,644 | $47,000 | $10,440 | $36,560 |
| 2014 | $1,457 | $47,520 | $11,520 | $36,000 |
Source: Public Records
Map
Nearby Homes
- 305 Birch Rill Dr
- 10255 Old Woodland Entry
- 300 Olmstead Way
- 201 Downing Dr Unit 76
- 3273 Long Indian Creek Ct
- 10421 Park Walk Point
- 3077 Haynes Trail
- 3073 Haynes Trail
- 10505 Ash Rill Dr
- 225 Wentworth Terrace
- 3335 Waters Mill Dr
- 10000 Barston Ct
- 725 High Hampton Run
- 335 Stanyan Place Unit 2
- 10050 Lauren Hall Ct
- 3430 Waters Mill Dr
- 10285 Rillridge Ct
- 10285 Rillridge Ct
- 10305 Rillridge Ct Unit 2
- 10310 Virginia Pine Ln
- 10275 Rillridge Ct
- 10300 Virginia Pine Ln
- 10280 Rillridge Ct
- 10315 Rillridge Ct
- 10270 Rillridge Ct
- 10290 Rillridge Ct
- 10320 Virginia Pine Ln
- 10265 Rillridge Ct
- 10300 Rillridge Ct Unit 2
- 10305 Virginia Pine Ln
- 10260 Rillridge Ct Unit 2
- 10275 Piney Ridge Walk
- 10325 Rillridge Ct Unit 3
- 10310 Rillridge Ct
- 10310 Rillridge Ct
- 10330 Virginia Pine Ln