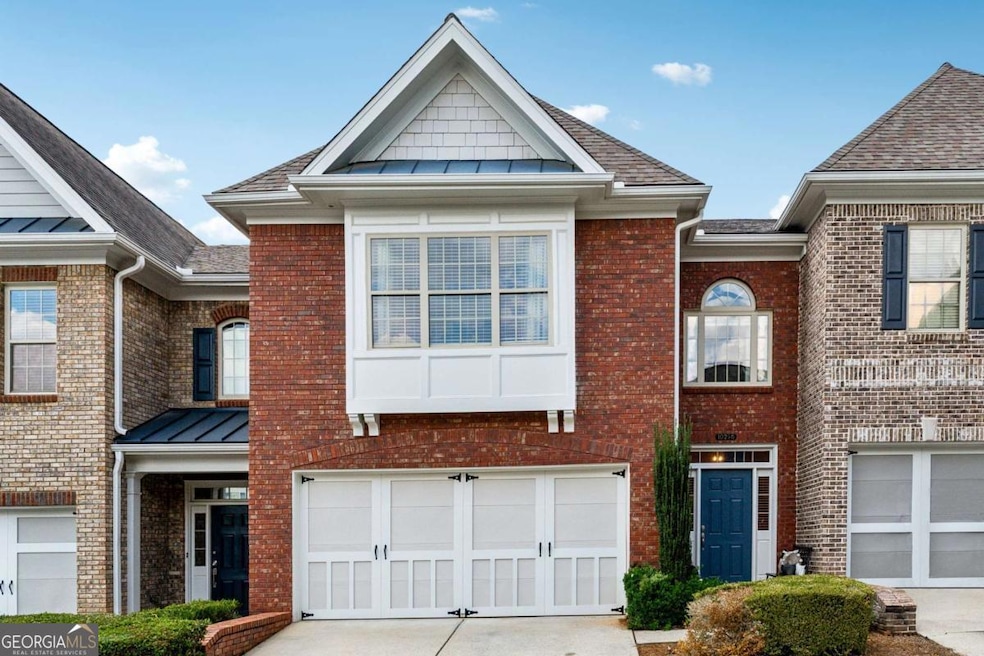


10296 Quadrant Ct Unit 76 Alpharetta, GA 30022
Estimated payment $3,527/month
Highlights
- Gated Community
- Property is near public transit
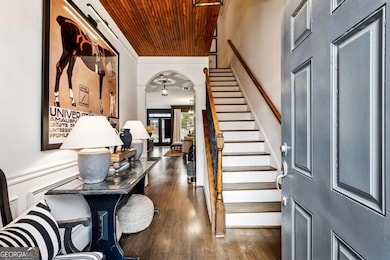
- Wood Flooring
- State Bridge Crossing Elementary School Rated A
- Traditional Architecture
- High Ceiling
About This Home
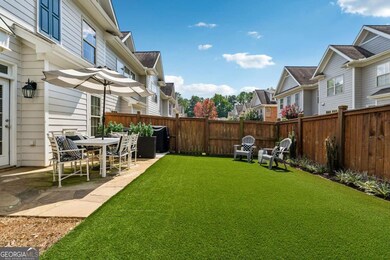
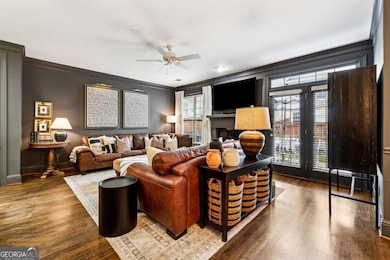
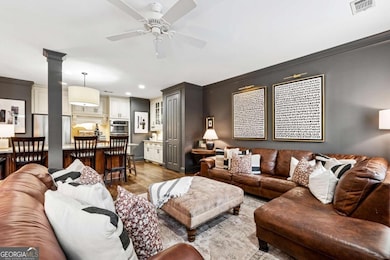
Enjoy your own fenced, level backyard with low-maintenance turf-a rare find for a townhome and perfect for relaxing, entertaining, or play. This beautiful home lives like a single-family residence, featuring an open-concept main level, spacious bedrooms, and generous closet space. Nestled in a sought-after gated swim community, it showcases elegant moldings, custom finishes, and thoughtful design throughout. Inside, the main level offers hardwood floors, great natural light, and seamless flow for everyday living. Upstairs, you'll find three bedrooms and two and a half bathrooms, including a primary suite with a sitting area ideal for a home office or private retreat. Located in the highly rated Johns Creek school district, this home is just minutes from shopping, dining, parks, and all the conveniences the area has to offer. A rare combination of comfort, style, and location!
Listing Agent
The Rezerve Brokerage Phone: 7705604493 License #283778 Listed on: 09/03/2025

Townhouse Details
Home Type
- Townhome
Est. Annual Taxes
- $2,707
Year Built
- Built in 2005
Lot Details
- 2,614 Sq Ft Lot
- Two or More Common Walls
- Back Yard Fenced
HOA Fees
- $350 Monthly HOA Fees
Parking
- 2 Car Garage
Home Design
- Traditional Architecture
- Brick Exterior Construction
- Slab Foundation
- Composition Roof
Interior Spaces
- 2,050 Sq Ft Home
- 2-Story Property
- High Ceiling
- Ceiling Fan
- Double Pane Windows
- Entrance Foyer
- Family Room with Fireplace
- Combination Dining and Living Room
Kitchen
- Microwave
- Dishwasher
- Kitchen Island
- Disposal
Flooring
- Wood
- Carpet
Bedrooms and Bathrooms
- 3 Bedrooms
- Walk-In Closet
Laundry
- Laundry Room
- Laundry on upper level
Home Security
Outdoor Features
- Patio
Location
- Property is near public transit
- Property is near schools
- Property is near shops
Schools
- State Bridge Crossing Elementary School
- Taylor Road Middle School
- Chattahoochee High School
Utilities
- Forced Air Heating and Cooling System
- High Speed Internet
- Phone Available
- Cable TV Available
Community Details
Overview
- $1,200 Initiation Fee
- Association fees include ground maintenance, pest control, swimming, trash
- Merrimont Subdivision
Recreation
- Community Pool
Security
- Gated Community
- Fire and Smoke Detector
Map
Home Values in the Area
Average Home Value in this Area
Tax History
| Year | Tax Paid | Tax Assessment Tax Assessment Total Assessment is a certain percentage of the fair market value that is determined by local assessors to be the total taxable value of land and additions on the property. | Land | Improvement |
|---|---|---|---|---|
| 2025 | $2,707 | $192,080 | $53,400 | $138,680 |
| 2023 | $4,448 | $157,600 | $33,880 | $123,720 |
| 2022 | $2,569 | $113,920 | $28,800 | $85,120 |
| 2021 | $2,553 | $118,480 | $25,040 | $93,440 |
| 2020 | $2,562 | $102,120 | $12,160 | $89,960 |
| 2019 | $289 | $100,320 | $11,960 | $88,360 |
| 2018 | $2,790 | $98,000 | $11,680 | $86,320 |
| 2017 | $2,369 | $81,760 | $11,280 | $70,480 |
| 2016 | $2,327 | $81,760 | $11,280 | $70,480 |
| 2015 | $2,352 | $81,760 | $11,280 | $70,480 |
| 2014 | $2,424 | $81,760 | $11,280 | $70,480 |
Property History
| Date | Event | Price | List to Sale | Price per Sq Ft |
|---|---|---|---|---|
| 10/21/2025 10/21/25 | Price Changed | $559,900 | -2.6% | $273 / Sq Ft |
| 09/03/2025 09/03/25 | For Sale | $575,000 | -- | $280 / Sq Ft |
Purchase History
| Date | Type | Sale Price | Title Company |
|---|---|---|---|
| Deed | $164,600 | -- | |
| Foreclosure Deed | $200,600 | -- | |
| Deed | $268,400 | -- |
Mortgage History
| Date | Status | Loan Amount | Loan Type |
|---|---|---|---|
| Open | $159,920 | New Conventional | |
| Previous Owner | $53,524 | Stand Alone Second | |
| Previous Owner | $214,097 | New Conventional | |
| Previous Owner | $53,524 | Stand Alone Second |
Source: Georgia MLS
MLS Number: 10596873
APN: 11-0590-0221-076-6
Disclaimer: Certain information contained herein is derived from information provided by parties other than Homes.com. All information provided is deemed reliable, but is not guaranteed to be accurate and should be independently verified.
![]() The data relating to real estate for sale on this web site comes in part from the Broker Reciprocity Program of Georgia MLS. Real estate listings held by brokerage firms other than Redfin are marked with the Broker Reciprocity logo and detailed information about them includes the name of the listing brokers. Information deemed reliable but not guaranteed. Copyright 2025 Georgia MLS. All rights reserved.
The data relating to real estate for sale on this web site comes in part from the Broker Reciprocity Program of Georgia MLS. Real estate listings held by brokerage firms other than Redfin are marked with the Broker Reciprocity logo and detailed information about them includes the name of the listing brokers. Information deemed reliable but not guaranteed. Copyright 2025 Georgia MLS. All rights reserved.
- 10281 Midway Ave
- 10265 Minion Ct Unit 27
- 5170 Cameron Forest Pkwy
- 230 Skidaway Ct
- 230 Pinebridge Ct
- 512 Winston Croft Cir Unit 57
- 510 Winston Croft Cir Unit 56
- 9950 Farmbrook Ln
- 10570 Bridgemor Dr
- 504 Winston Croft Cir Unit 54
- 1003 Crown Oak St Unit 43
- 1005 Crown Oak St Unit 44
- 1007 Crown Oak St Unit 45
- 1011 Crown Oak St Unit 47
- 720 Buttercup Trace
- 10275 Groomsbridge Rd
- 220 Magnolia Tree Ct
- 10285 Groomsbridge Rd Unit 5
- 5345 Cameron Forest Pkwy
- 309 Mannes Ln
- 925 Carters Grove Trail
- 159 Wards Crossing Way
- 10780 Mortons Crossing
- 4885 Streamside Dr
- 10830 Mortons Crossing
- 10650 Allon Cove Unit 137
- 5685 Lake Manor Close
- 4800 Streamside Dr
- 11080 Mortons Crossing
- 9814 Murano View
- 4822 Abberley Ln
- 4935 Tanners Spring Dr
- 10898 Gallier St
- 5630 Lawley Dr
- 9753 Palmeston Place
- 350 Saddle Bridge Dr
- 130 Anclote Ct
- 10840 State Bridge Rd