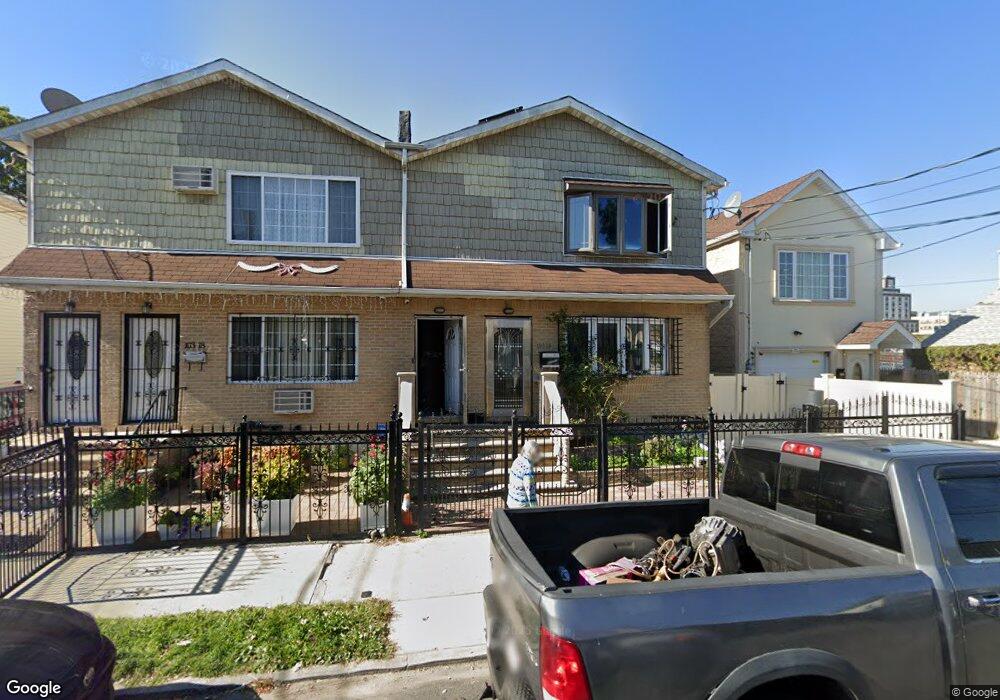
103-14 169th St Jamaica, NY 11433
Jamaica NeighborhoodEstimated Value: $1,011,000 - $1,388,000
6
Beds
5
Baths
2,852
Sq Ft
$433/Sq Ft
Est. Value
About This Home
This home is located at 103-14 169th St, Jamaica, NY 11433 and is currently estimated at $1,235,643, approximately $433 per square foot. 103-14 169th St is a home located in Queens County with nearby schools including P.S./I.S. 116 William C Hughley and I.S. 238 Susan B Anthony Academy.
Ownership History
Date
Name
Owned For
Owner Type
Purchase Details
Closed on
Apr 15, 2004
Sold by
Khan David
Bought by
Pierre Wilma T
Current Estimated Value
Home Financials for this Owner
Home Financials are based on the most recent Mortgage that was taken out on this home.
Original Mortgage
$427,000
Interest Rate
5.36%
Mortgage Type
Purchase Money Mortgage
Purchase Details
Closed on
Jul 19, 2001
Sold by
Nat Holding Corp
Bought by
Khan David
Home Financials for this Owner
Home Financials are based on the most recent Mortgage that was taken out on this home.
Original Mortgage
$328,700
Interest Rate
7.1%
Purchase Details
Closed on
Dec 13, 2000
Sold by
Abdelmalek Emad
Bought by
Nat Holding Corp
Purchase Details
Closed on
Nov 9, 2000
Sold by
Belton Matilda Mills and Mills Florrie
Bought by
Abdelmalek Emad
Create a Home Valuation Report for This Property
The Home Valuation Report is an in-depth analysis detailing your home's value as well as a comparison with similar homes in the area
Home Values in the Area
Average Home Value in this Area
Purchase History
| Date | Buyer | Sale Price | Title Company |
|---|---|---|---|
| Pierre Wilma T | $515,000 | -- | |
| Khan David | -- | -- | |
| Nat Holding Corp | $41,000 | First American Title Ins Co | |
| Abdelmalek Emad | $19,500 | -- |
Source: Public Records
Mortgage History
| Date | Status | Borrower | Loan Amount |
|---|---|---|---|
| Previous Owner | Pierre Wilma T | $427,000 | |
| Previous Owner | Khan David | $328,700 |
Source: Public Records
Tax History Compared to Growth
Tax History
| Year | Tax Paid | Tax Assessment Tax Assessment Total Assessment is a certain percentage of the fair market value that is determined by local assessors to be the total taxable value of land and additions on the property. | Land | Improvement |
|---|---|---|---|---|
| 2025 | $7,757 | $38,621 | $9,485 | $29,136 |
| 2024 | $7,757 | $38,621 | $11,366 | $27,255 |
| 2023 | $7,699 | $38,330 | $9,523 | $28,807 |
| 2022 | $7,219 | $57,180 | $16,740 | $40,440 |
| 2021 | $5,122 | $47,400 | $16,740 | $30,660 |
| 2020 | $4,755 | $48,960 | $16,740 | $32,220 |
| 2019 | $4,675 | $41,940 | $16,740 | $25,200 |
| 2018 | $6,511 | $31,942 | $13,421 | $18,521 |
| 2017 | $6,143 | $30,134 | $13,116 | $17,018 |
| 2016 | $5,683 | $30,134 | $13,116 | $17,018 |
| 2015 | $4,099 | $26,820 | $18,600 | $8,220 |
| 2014 | $4,099 | $26,820 | $18,600 | $8,220 |
Source: Public Records
Map
Nearby Homes
- 10315 169th St
- 16905 104th Ave
- 166-12 Douglas Ave
- 10513 171st St
- 10529 171st St
- 168-63 93rd Ave
- 10519 171st Place
- 16823 93rd Ave
- 173-18 103rd Rd
- 107-54 Merrick Blvd
- 107-06 165th St
- 17508 93rd Ave
- 109-15 Lot A Guy R Brewer Blvd
- 17347 105th Ave
- 172-09 108th Ave
- 172-18 Jamaica Ave Unit 2-B
- 106-49 Guy R Brewer Blvd
- 173-61 105th Ave
- 10331 177th St
- 104-07 177th St
- 10314 169th St
- 10312 169th St
- 10318 169th St
- 10320 169th St
- 115 Jamaica
- 74 206 Ave
- 10 Bay 31 St
- 163 Crest Rd
- 1151-07220 Street
- 1151-00220 Street
- 1151-10218 Street
- 1151-15220 Street
- 1151-16221 Street
- 1151-02218 Street
- 1151-06218 Street
- 1151-08220 Street
- 10-06 100 Place
- 1005 20 St
- 1141-34230 Street
- 10 Sheridan Ave