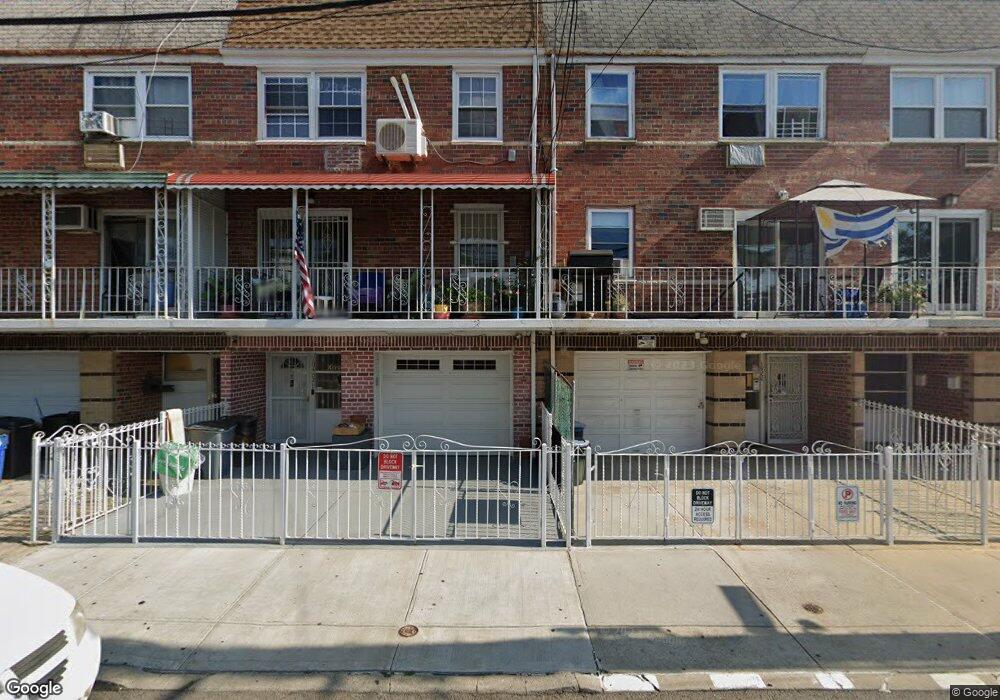
103-54 51st Ave Unit 2 Corona, NY 11368
Corona NeighborhoodEstimated Value: $1,453,000 - $1,551,000
3
Beds
2
Baths
3,040
Sq Ft
$492/Sq Ft
Est. Value
About This Home
This home is located at 103-54 51st Ave Unit 2, Corona, NY 11368 and is currently estimated at $1,495,333, approximately $491 per square foot. 103-54 51st Ave Unit 2 is a home located in Queens County with nearby schools including P.S. 14 - Fairview, Is 61 Leonardo Da Vinci, and John Bowne High School.
Ownership History
Date
Name
Owned For
Owner Type
Purchase Details
Closed on
Jun 10, 2020
Sold by
Rosero Elias Antonio and Rosero Lorena F
Bought by
Rodero Elias F and Rodero Melida F
Current Estimated Value
Home Financials for this Owner
Home Financials are based on the most recent Mortgage that was taken out on this home.
Original Mortgage
$653,550
Interest Rate
3.2%
Mortgage Type
New Conventional
Purchase Details
Closed on
Jun 11, 1996
Sold by
Colaire Arthur and Colaire Avanelle
Bought by
Rosero Elias and Rosero Melida
Home Financials for this Owner
Home Financials are based on the most recent Mortgage that was taken out on this home.
Original Mortgage
$210,000
Interest Rate
8.37%
Create a Home Valuation Report for This Property
The Home Valuation Report is an in-depth analysis detailing your home's value as well as a comparison with similar homes in the area
Home Values in the Area
Average Home Value in this Area
Purchase History
| Date | Buyer | Sale Price | Title Company |
|---|---|---|---|
| Rodero Elias F | -- | -- | |
| Rosero Elias A | -- | -- | |
| Rosero Elias | $280,000 | First American Title Ins Co | |
| Rosero Elias | $280,000 | First American Title Ins Co |
Source: Public Records
Mortgage History
| Date | Status | Borrower | Loan Amount |
|---|---|---|---|
| Previous Owner | Rosero Elias A | $653,550 | |
| Previous Owner | Rosero Elias | $210,000 |
Source: Public Records
Tax History Compared to Growth
Tax History
| Year | Tax Paid | Tax Assessment Tax Assessment Total Assessment is a certain percentage of the fair market value that is determined by local assessors to be the total taxable value of land and additions on the property. | Land | Improvement |
|---|---|---|---|---|
| 2025 | $12,880 | $72,001 | $11,975 | $60,026 |
| 2024 | $12,984 | $67,925 | $13,539 | $54,386 |
| 2023 | $12,107 | $64,080 | $14,166 | $49,914 |
| 2022 | $4,165 | $67,080 | $14,040 | $53,040 |
| 2021 | $5,714 | $67,920 | $14,040 | $53,880 |
| 2020 | $5,748 | $70,800 | $14,040 | $56,760 |
| 2019 | $5,315 | $78,000 | $14,040 | $63,960 |
| 2018 | $4,833 | $53,881 | $11,939 | $41,942 |
| 2017 | $4,535 | $50,832 | $13,014 | $37,818 |
| 2016 | $4,424 | $50,832 | $13,014 | $37,818 |
| 2015 | $2,453 | $50,450 | $15,560 | $34,890 |
| 2014 | $2,453 | $47,595 | $14,679 | $32,916 |
Source: Public Records
Map
Nearby Homes
- 106-16 Corona Ave
- 10337 52nd Ave
- 10364 52nd Ave
- 4913 106th St
- 103-26 Alstyne Ave
- 50-41 103rd St
- 104-47 49th Ave
- 104-49 49th Ave
- 10603 49th Ave
- 10605 49th Ave
- 10211 Strong Ave
- 5507 103rd St
- 102-01 Strong Ave
- 10464 48th Ave
- 102-62 Nicolls Ave
- 5409 108th St Unit 6A
- 54-09 108th St Unit 3A
- 10827 50th Ave
- 103-18 Martense Ave
- 10831 50th Ave Unit 3A
- 103-54 51st Ave Unit 3
- 10354 51st Ave
- 10352 51st Ave
- 104-02 51st Ave Unit 3
- 104-02 51st Ave
- 10356 51st Ave
- 10350 51st Ave
- 10402 51st Ave
- 10404 51st Ave
- 10348 51st Ave
- 10406 51st Ave
- 10346 51st Ave
- 10408 51st Ave
- 10351 52nd Ave
- 10355 52nd Ave
- 10344 51st Ave
- 103-55 52nd Ave
- 10357 52nd Ave
- 10349 52nd Ave
- 10359 52nd Ave