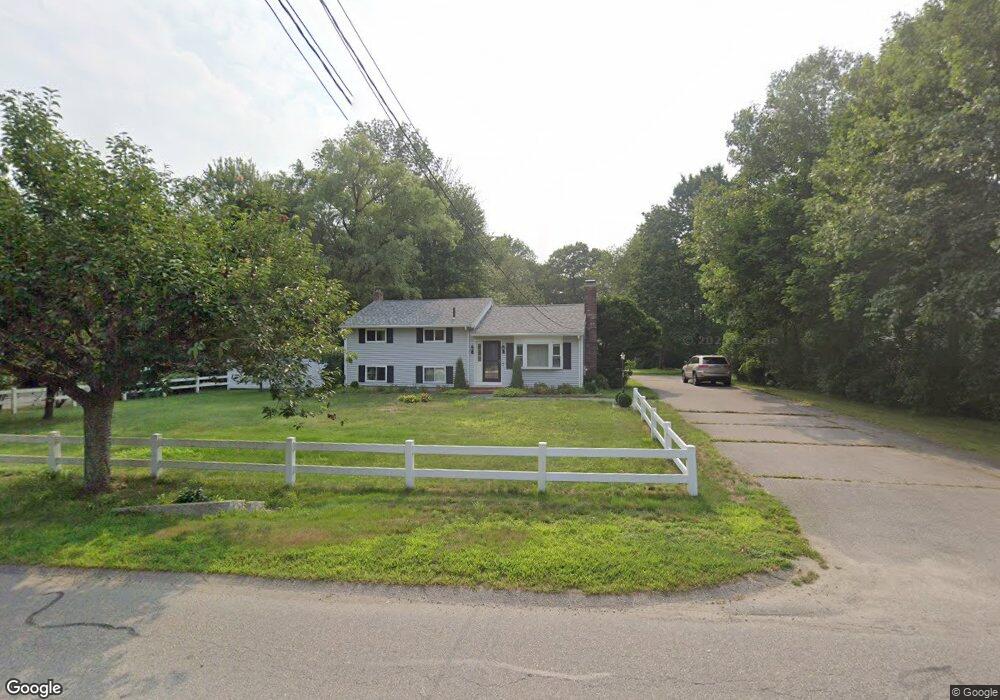
103 Acorn St Millis, MA 02054
Estimated Value: $588,795 - $683,000
3
Beds
1
Bath
1,260
Sq Ft
$507/Sq Ft
Est. Value
About This Home
This home is located at 103 Acorn St, Millis, MA 02054 and is currently estimated at $638,199, approximately $506 per square foot. 103 Acorn St is a home located in Norfolk County with nearby schools including Clyde F Brown, Millis Middle School, and Millis High School.
Ownership History
Date
Name
Owned For
Owner Type
Purchase Details
Closed on
Nov 12, 2024
Sold by
Hebeler Robert J
Bought by
Robert J Hebeler Ret and Hebeler
Current Estimated Value
Purchase Details
Closed on
Apr 19, 2001
Sold by
Aviza Stanley J and Aviza Janice A
Bought by
Hebeler Robert J
Create a Home Valuation Report for This Property
The Home Valuation Report is an in-depth analysis detailing your home's value as well as a comparison with similar homes in the area
Home Values in the Area
Average Home Value in this Area
Purchase History
| Date | Buyer | Sale Price | Title Company |
|---|---|---|---|
| Robert J Hebeler Ret | -- | None Available | |
| Robert J Hebeler Ret | -- | None Available | |
| Hebeler Robert J | $275,000 | -- |
Source: Public Records
Mortgage History
| Date | Status | Borrower | Loan Amount |
|---|---|---|---|
| Previous Owner | Hebeler Robert J | $100,000 | |
| Previous Owner | Hebeler Robert J | $65,000 |
Source: Public Records
Tax History
| Year | Tax Paid | Tax Assessment Tax Assessment Total Assessment is a certain percentage of the fair market value that is determined by local assessors to be the total taxable value of land and additions on the property. | Land | Improvement |
|---|---|---|---|---|
| 2025 | $7,947 | $484,600 | $188,600 | $296,000 |
| 2024 | $7,269 | $442,700 | $188,600 | $254,100 |
| 2023 | $6,896 | $394,300 | $164,000 | $230,300 |
| 2022 | $7,418 | $392,900 | $164,000 | $228,900 |
| 2021 | $7,085 | $361,100 | $164,000 | $197,100 |
| 2020 | $6,936 | $344,400 | $153,300 | $191,100 |
| 2019 | $6,078 | $325,000 | $144,400 | $180,600 |
| 2018 | $5,620 | $311,900 | $131,300 | $180,600 |
| 2017 | $5,743 | $311,800 | $137,500 | $174,300 |
| 2016 | $5,438 | $311,800 | $137,500 | $174,300 |
| 2015 | $5,301 | $311,800 | $137,500 | $174,300 |
Source: Public Records
Map
Nearby Homes
- 13 Teresa Dr
- 14 Teresa Dr
- 33 Spencer St
- 5 Apple Rock Rd
- 188 Pleasant St
- 200 Pleasant St
- 1 Granite Dr
- 1032 Main St Unit 6
- 216 Plain St
- 40 Lakeshore Dr
- 10 April Way
- 14 April Way
- 488R Main St
- 1280 Main St
- 25 Bayberry Cir Unit 25
- 22 May Rd
- 20 Hemlock Cir
- 10 Barber St
- 20 Broad St Unit 1
- 20 Broad St Unit 6
Your Personal Tour Guide
Ask me questions while you tour the home.