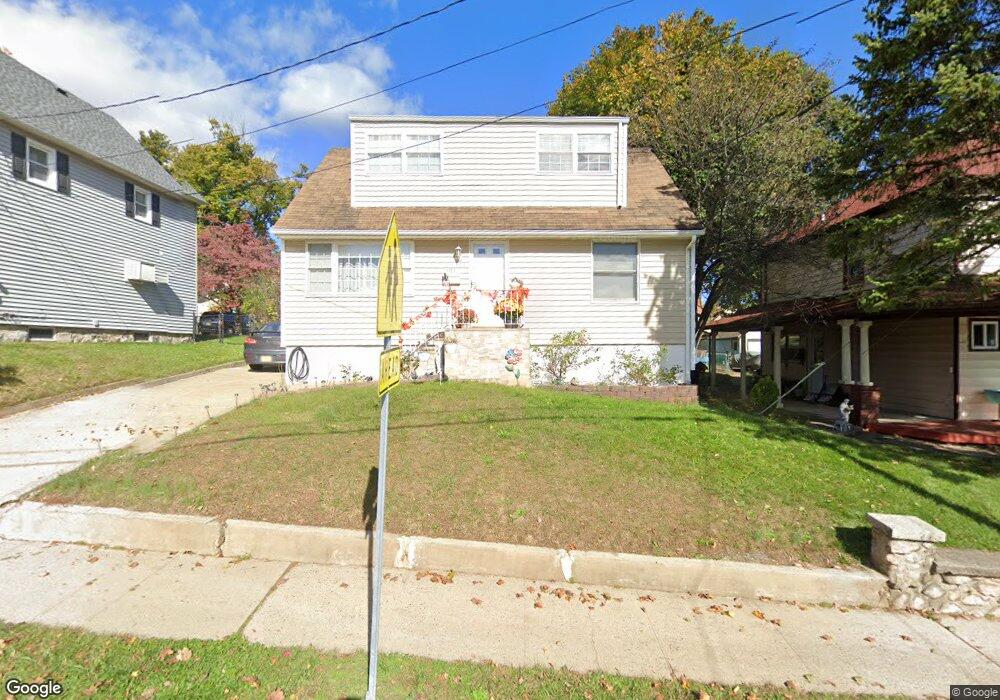
103 Allen St Netcong, NJ 07857
Estimated Value: $380,882 - $460,000
Studio
--
Bath
1,228
Sq Ft
$341/Sq Ft
Est. Value
About This Home
This home is located at 103 Allen St, Netcong, NJ 07857 and is currently estimated at $418,221, approximately $340 per square foot. 103 Allen St is a home located in Morris County with nearby schools including Netcong Elementary School and Lenape Val Regional High School.
Ownership History
Date
Name
Owned For
Owner Type
Purchase Details
Closed on
Nov 29, 2004
Sold by
Perez Frank
Bought by
Atehortua Carlos and Atehortua Marisol
Current Estimated Value
Purchase Details
Closed on
Dec 20, 1998
Sold by
Valletta Bernard and Valletta Louise
Bought by
Perez Raean and Perez Frank
Home Financials for this Owner
Home Financials are based on the most recent Mortgage that was taken out on this home.
Original Mortgage
$118,038
Interest Rate
6.7%
Mortgage Type
FHA
Create a Home Valuation Report for This Property
The Home Valuation Report is an in-depth analysis detailing your home's value as well as a comparison with similar homes in the area
Home Values in the Area
Average Home Value in this Area
Purchase History
| Date | Buyer | Sale Price | Title Company |
|---|---|---|---|
| Atehortua Carlos | $272,000 | -- | |
| Perez Raean | $119,800 | -- |
Source: Public Records
Mortgage History
| Date | Status | Borrower | Loan Amount |
|---|---|---|---|
| Previous Owner | Perez Raean | $118,038 |
Source: Public Records
Tax History
| Year | Tax Paid | Tax Assessment Tax Assessment Total Assessment is a certain percentage of the fair market value that is determined by local assessors to be the total taxable value of land and additions on the property. | Land | Improvement |
|---|---|---|---|---|
| 2025 | $7,733 | $226,300 | $102,100 | $124,200 |
| 2024 | $7,801 | $226,300 | $102,100 | $124,200 |
Source: Public Records
Map
Nearby Homes
- 35 Hillside Ave
- 20 Barone St
- 79 Main St
- 7 Walton Place
- 0 Lawrence Ave
- 74 Main St
- 49 Brooklyn Rd
- 8 Hillside Ave
- 2 Roberts Place
- 22 Kelly Place
- 58 Brooklyn Rd
- 16-18 King St
- 22 Lloyd Ave
- 0 Swayze Pl Lawrence Ave
- 31 Highland Ave
- 4 Elizabeth Ave
- 4 Lloyd Ave
- 1 Smith St
- 579 Dell Place Unit 79
- 573 Dell Place Unit 73
Your Personal Tour Guide
Ask me questions while you tour the home.