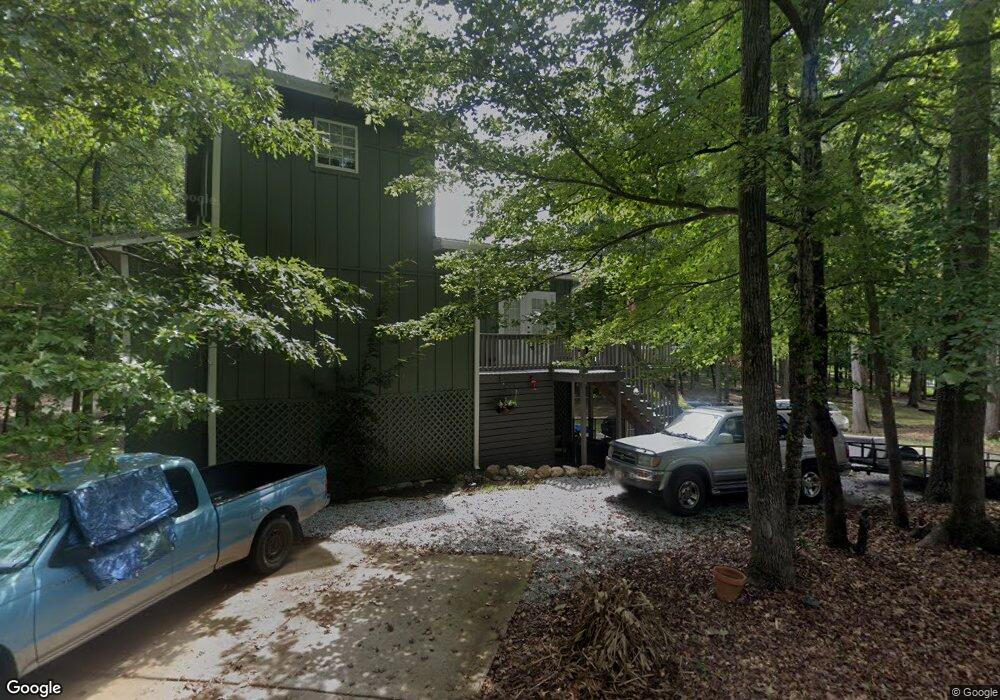
103 Allens Alley Eatonton, GA 31024
Estimated Value: $418,000 - $608,000
--
Bed
--
Bath
1,569
Sq Ft
$324/Sq Ft
Est. Value
About This Home
This home is located at 103 Allens Alley, Eatonton, GA 31024 and is currently estimated at $508,835, approximately $324 per square foot. 103 Allens Alley is a home with nearby schools including Putnam County Primary School, Putnam County Elementary School, and Putnam County Middle School.
Ownership History
Date
Name
Owned For
Owner Type
Purchase Details
Closed on
Oct 22, 2010
Sold by
Stevens Bradley
Bought by
Fletcher Linda B
Current Estimated Value
Home Financials for this Owner
Home Financials are based on the most recent Mortgage that was taken out on this home.
Original Mortgage
$185,200
Outstanding Balance
$122,399
Interest Rate
4.38%
Mortgage Type
New Conventional
Estimated Equity
$386,436
Purchase Details
Closed on
Jan 20, 2005
Sold by
Williams Ronald E
Bought by
Stevens Bradley and Stevens Pamela N
Home Financials for this Owner
Home Financials are based on the most recent Mortgage that was taken out on this home.
Original Mortgage
$155,000
Interest Rate
5.66%
Mortgage Type
New Conventional
Purchase Details
Closed on
Sep 4, 2001
Sold by
Corley Fred S
Bought by
Williams Ronald E
Purchase Details
Closed on
Jun 19, 2001
Sold by
Porter Thomas H
Bought by
Corley Fred S
Purchase Details
Closed on
Jan 22, 1977
Bought by
Porter Thomas H
Create a Home Valuation Report for This Property
The Home Valuation Report is an in-depth analysis detailing your home's value as well as a comparison with similar homes in the area
Home Values in the Area
Average Home Value in this Area
Purchase History
| Date | Buyer | Sale Price | Title Company |
|---|---|---|---|
| Fletcher Linda B | -- | -- | |
| Stevens Bradley | $175,000 | -- | |
| Williams Ronald E | $90,000 | -- | |
| Corley Fred S | $45,000 | -- | |
| Porter Thomas H | $7,000 | -- |
Source: Public Records
Mortgage History
| Date | Status | Borrower | Loan Amount |
|---|---|---|---|
| Open | Fletcher Linda B | $185,200 | |
| Previous Owner | Stevens Bradley | $155,000 |
Source: Public Records
Tax History Compared to Growth
Tax History
| Year | Tax Paid | Tax Assessment Tax Assessment Total Assessment is a certain percentage of the fair market value that is determined by local assessors to be the total taxable value of land and additions on the property. | Land | Improvement |
|---|---|---|---|---|
| 2024 | $2,389 | $138,697 | $51,000 | $87,697 |
| 2023 | $2,389 | $139,099 | $51,000 | $88,099 |
| 2022 | $2,740 | $136,451 | $51,000 | $85,451 |
| 2021 | $2,121 | $93,094 | $37,400 | $55,694 |
| 2020 | $2,249 | $92,837 | $37,800 | $55,037 |
| 2019 | $2,270 | $93,869 | $37,800 | $56,069 |
| 2018 | $2,221 | $88,913 | $35,000 | $53,913 |
| 2017 | $2,005 | $88,913 | $35,000 | $53,913 |
| 2016 | $2,007 | $88,913 | $35,000 | $53,913 |
| 2015 | $1,934 | $88,913 | $35,000 | $53,914 |
| 2014 | $1,937 | $88,914 | $35,000 | $53,914 |
Source: Public Records
Map
Nearby Homes
- 114 Allens Alley
- 0 Phillips Rd Unit 10307410
- 112 Cedar Ln NW
- 118 & 120 Buckeye Ln NW
- 118&120 Buckeye Ln
- 194 Phillips Rd
- 0 Mcdade Rd Unit 10545345
- 0 Mcdade Rd Unit 10545336
- 0 Mcdade Rd Unit 10545325
- 0 Mcdade Rd Unit 23668134
- 0 Mcdade Rd Unit 23668135
- 143 Napier Dr
- 106 Horseshoe Bend Rd SW
- 108 Horseshoe Bend Rd SW
- 148 Bentley Dr NW
- 162 Bentley Dr NW
- 0 Napier Dr SW Unit 7515422
- 0 Napier Dr SW Unit 10448037
- 125 Bentley Dr NW
- 106 Oak Ln
- 108 Allens Alley Unit 24
- 108 Allen's Alley
- 101 Allens Alley
- 135 Whipporwill Ln
- 104 Allens Alley
- 110 Allens Alley
- 102 Allens Alley
- 133 Whipporwill Ln
- 132 Whipporwill Ln
- 115 Allens Alley
- 129 Whipporwill Ln
- 127 Whipporwill Ln
- 116 Allens Alley
- 151 Whipporwill Ln
- 125 Whipporwill Ln
- 0 Whipporwill Ln Unit 8511767
- 0 Whipporwill Ln Unit 8240097
- 0 Whipporwill Ln Unit 7218981
- 0 Whipporwill Ln
- 123 Whipporwill Ln