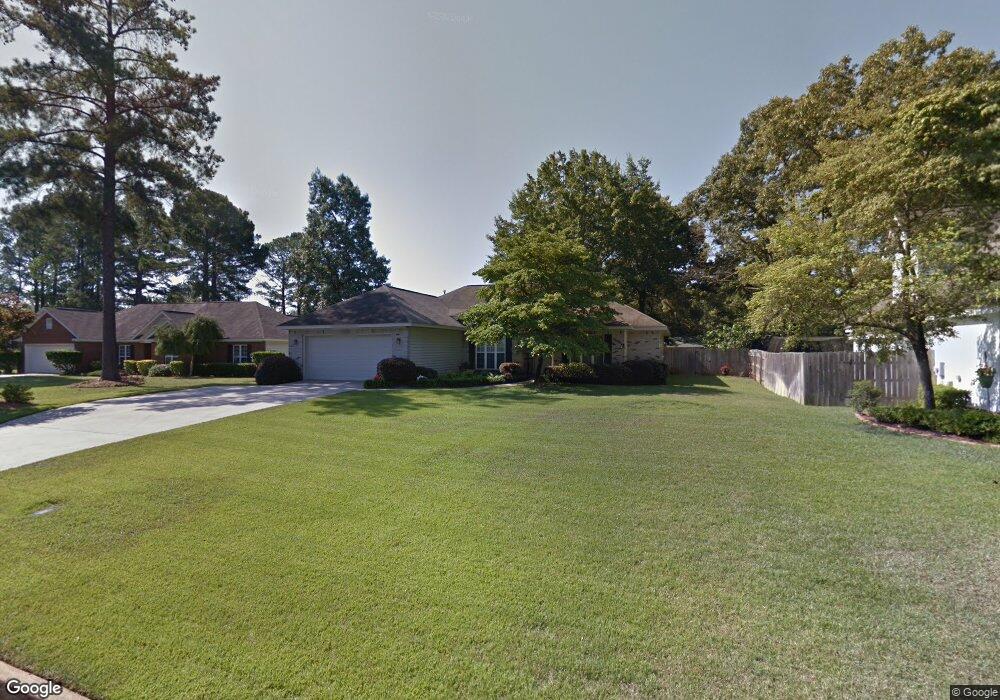
103 Anjul Ct Warner Robins, GA 31093
Estimated Value: $203,000 - $250,000
3
Beds
2
Baths
1,782
Sq Ft
$129/Sq Ft
Est. Value
About This Home
This home is located at 103 Anjul Ct, Warner Robins, GA 31093 and is currently estimated at $229,752, approximately $128 per square foot. 103 Anjul Ct is a home located in Houston County with nearby schools including Westside Elementary School, Northside Middle School, and Northside High School.
Ownership History
Date
Name
Owned For
Owner Type
Purchase Details
Closed on
Jun 18, 1996
Sold by
Busbee Construction Inc
Bought by
Mcgregor Richard E
Current Estimated Value
Purchase Details
Closed on
Jan 24, 1995
Sold by
Cribb Robert T
Bought by
Busbee Construction Inc
Purchase Details
Closed on
Mar 4, 1992
Sold by
Citizens Bank Of Americus
Bought by
Cribb Robert T
Purchase Details
Closed on
Mar 2, 1992
Sold by
Pinckney Martin B
Bought by
Citizens Bank Of Americus
Purchase Details
Closed on
Sep 23, 1986
Sold by
Dominion Federal Savings & Loa
Bought by
Pinckney Martin B
Purchase Details
Closed on
Jun 10, 1985
Sold by
Farmland Mortgage Inc
Bought by
Dominion Federal Savings & Loan
Purchase Details
Closed on
Jul 16, 1982
Sold by
Hanson Irving D
Bought by
Farmland Mortgage Inc
Purchase Details
Closed on
Apr 20, 1982
Sold by
Mac Company
Bought by
Hanson Irving D
Purchase Details
Closed on
Feb 10, 1966
Bought by
Mac Company
Create a Home Valuation Report for This Property
The Home Valuation Report is an in-depth analysis detailing your home's value as well as a comparison with similar homes in the area
Home Values in the Area
Average Home Value in this Area
Purchase History
| Date | Buyer | Sale Price | Title Company |
|---|---|---|---|
| Mcgregor Richard E | $116,300 | -- | |
| Busbee Construction Inc | -- | -- | |
| Cribb Robert T | -- | -- | |
| Citizens Bank Of Americus | -- | -- | |
| Pinckney Martin B | -- | -- | |
| Dominion Federal Savings & Loan | -- | -- | |
| Farmland Mortgage Inc | -- | -- | |
| Hanson Irving D | -- | -- | |
| Mac Company | -- | -- |
Source: Public Records
Tax History Compared to Growth
Tax History
| Year | Tax Paid | Tax Assessment Tax Assessment Total Assessment is a certain percentage of the fair market value that is determined by local assessors to be the total taxable value of land and additions on the property. | Land | Improvement |
|---|---|---|---|---|
| 2024 | $2,392 | $74,480 | $6,000 | $68,480 |
| 2023 | $2,005 | $62,200 | $6,000 | $56,200 |
| 2022 | $1,311 | $59,000 | $6,000 | $53,000 |
| 2021 | $1,189 | $53,440 | $6,000 | $47,440 |
| 2020 | $1,179 | $52,760 | $6,000 | $46,760 |
| 2019 | $1,179 | $52,760 | $6,000 | $46,760 |
| 2018 | $1,179 | $52,760 | $6,000 | $46,760 |
| 2017 | $1,180 | $52,760 | $6,000 | $46,760 |
| 2016 | $1,182 | $52,760 | $6,000 | $46,760 |
| 2015 | -- | $52,760 | $6,000 | $46,760 |
| 2014 | -- | $52,760 | $6,000 | $46,760 |
| 2013 | -- | $53,080 | $6,000 | $47,080 |
Source: Public Records
Map
Nearby Homes
- 103 Westcliff Cir Unit A
- 103 Westcliff Cir Unit A
- 102 Westcliff Center St Unit D
- 110 Westcliff Center St
- 110 Westcliff Cir Unit C
- 102 Williams St
- 86 Westcliff Cir
- 106 Westcliff Cir
- 110 Merlin St
- 200 Ridgeland Dr
- 300 Meadowridge Dr
- 316 Meadowridge Dr
- 111 Oakridge Dr
- 123 Tanglewood Dr
- 110 Foxfire Dr
- 141 Peacock Dr
- 221 Gilchrist Dr
- 112 Peacock Dr
- 118 Meadowcliff Cir
- 725 B East Side Dr
- 101 Anjul Ct
- 407 Westcliff Cir
- 409 Westcliff Cir
- 405 Westcliff Cir Unit A
- 405 Westcliff Cir
- 405 Westcliff Cir
- 201 Anjul Ct
- 411 Westcliff Cir
- 126 English Oak Ln
- 136 English Oak Ln
- 122 Laurel Oak Ln
- 403 Westcliff Cir
- 413 Westcliff Cir
- 124 English Oak Ln
- 203 Anjul St
- 315 Westcliff Center St
- 104 Anjul Ct
- 102 Anjul Ct
- 313 Westcliff Center St
- 123 Laurel Oak Ln