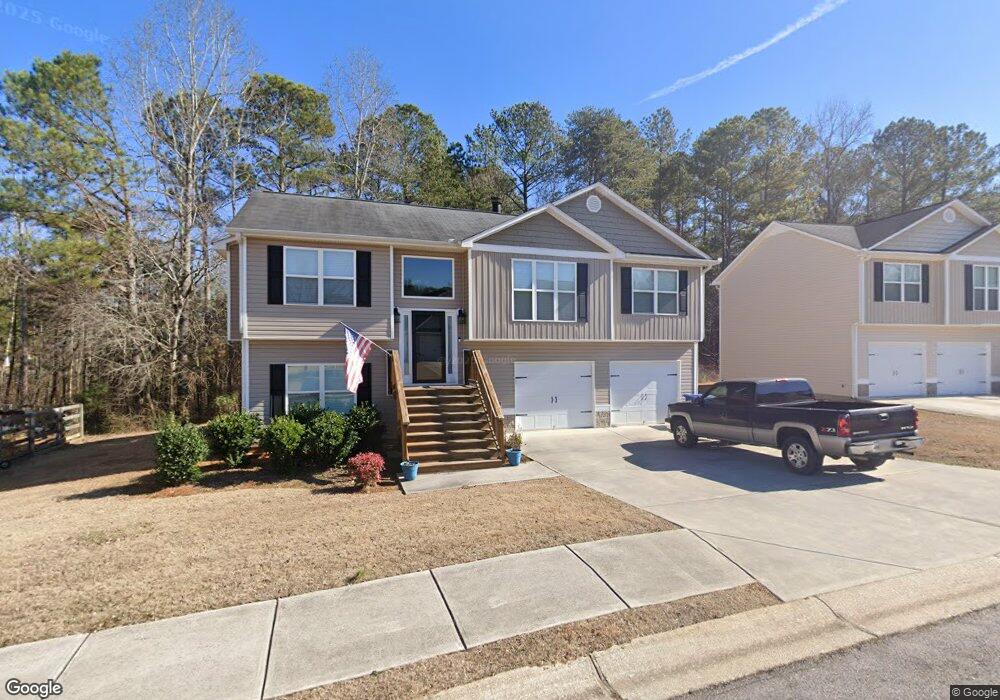
103 Autumn Brooke Trail Unit 70 Dallas, GA 30157
Estimated Value: $301,911 - $313,000
3
Beds
2
Baths
1,287
Sq Ft
$238/Sq Ft
Est. Value
About This Home
This home is located at 103 Autumn Brooke Trail Unit 70, Dallas, GA 30157 and is currently estimated at $306,228, approximately $237 per square foot. 103 Autumn Brooke Trail Unit 70 is a home located in Paulding County with nearby schools including Allgood Elementary School, Herschel Jones Middle School, and Paulding County High School.
Ownership History
Date
Name
Owned For
Owner Type
Purchase Details
Closed on
Jun 4, 2020
Sold by
Property Owner 10 Llc
Bought by
Progress Residential Borrower 14 Llc
Current Estimated Value
Purchase Details
Closed on
Jul 25, 2019
Sold by
Jenson Paul
Bought by
Property Owner 10 Llc
Purchase Details
Closed on
Jul 14, 2017
Sold by
Wilhelml Larry J
Bought by
Jensen Paul and Jensen Jacqueline S
Home Financials for this Owner
Home Financials are based on the most recent Mortgage that was taken out on this home.
Original Mortgage
$127,920
Interest Rate
3.91%
Mortgage Type
New Conventional
Purchase Details
Closed on
Nov 21, 2014
Sold by
S & S Homes Inc
Bought by
Equity Trust Co Custodian Fbo and Wilhelmi Larry J Ira
Purchase Details
Closed on
May 30, 2014
Sold by
Affinity Bank
Bought by
S & S Homes Inc
Create a Home Valuation Report for This Property
The Home Valuation Report is an in-depth analysis detailing your home's value as well as a comparison with similar homes in the area
Home Values in the Area
Average Home Value in this Area
Purchase History
| Date | Buyer | Sale Price | Title Company |
|---|---|---|---|
| Progress Residential Borrower 14 Llc | -- | -- | |
| Property Owner 10 Llc | $189,000 | -- | |
| Jensen Paul | $159,900 | -- | |
| Equity Trust Co Custodian Fbo | $135,000 | -- | |
| S & S Homes Inc | $45,000 | -- |
Source: Public Records
Mortgage History
| Date | Status | Borrower | Loan Amount |
|---|---|---|---|
| Previous Owner | Jensen Paul | $127,920 |
Source: Public Records
Tax History Compared to Growth
Tax History
| Year | Tax Paid | Tax Assessment Tax Assessment Total Assessment is a certain percentage of the fair market value that is determined by local assessors to be the total taxable value of land and additions on the property. | Land | Improvement |
|---|---|---|---|---|
| 2024 | $3,962 | $126,964 | $12,000 | $114,964 |
| 2023 | $3,329 | $110,084 | $12,000 | $98,084 |
| 2022 | $2,535 | $97,236 | $12,000 | $85,236 |
| 2021 | $2,150 | $73,988 | $8,000 | $65,988 |
| 2020 | $2,359 | $69,644 | $8,000 | $61,644 |
| 2019 | $2,010 | $58,604 | $8,000 | $50,604 |
| 2018 | $1,744 | $57,900 | $12,000 | $45,900 |
| 2017 | $1,720 | $49,532 | $12,800 | $36,732 |
| 2016 | $1,630 | $47,364 | $12,800 | $34,564 |
| 2015 | $1,453 | $47,196 | $12,800 | $34,396 |
| 2014 | $64 | $2,040 | $2,040 | $0 |
| 2013 | -- | $1,280 | $1,280 | $0 |
Source: Public Records
Map
Nearby Homes
- 120 Remington Place Blvd
- 212 Remington Place Blvd
- 102 Natalie Ct
- 305 Remington Place Blvd
- 361 West Ave
- 98 Shawnee Trail Unit 30
- 98 Shawnee Trail
- 146 Shawnee Trail Unit Lot 27
- 146 Shawnee Trail
- 512 Oak View Ln
- 510 Oak View Ln
- 508 Oak View Ln
- 47 Whitley Ct
- 0 Shawnee Trail Unit LOT 6 10506625
- 0 Shawnee Trail Unit 7565433
- Robie Plan at Oakleigh Glen
- Penwell Plan at Oakleigh Glen
- Belhaven Plan at Oakleigh Glen
- 103 Autumn Brooke Trail
- 101 Autumn Brooke Trail
- 105 Autumn Brooke Trail Unit 71
- 105 Autumn Brooke Trail
- 0 Autumn Brooke Trail Unit 70,71,74,76 7105726
- 0 Autumn Brooke Trail Unit 8670854
- 0 Autumn Brooke Trail Unit 7340000
- 0 Autumn Brooke Trail Unit 8245114
- 0 Autumn Brooke Trail Unit 8631155
- 107 Autumn Brooke Trail
- 0 Cole Creek Dr Unit 8661621
- 0 Cole Creek Dr Unit 8647492
- 0 Cole Creek Dr Unit 8644885
- 0 Cole Creek Dr Unit 8276132
- 0 Cole Creek Dr Unit 8241696
- 0 Cole Creek Dr Unit 7514780
- 0 Cole Creek Dr Unit 7274911
- 0 Cole Creek Dr Unit 7262685
- 0 Cole Creek Dr Unit 8994663
- 0 Cole Creek Dr Unit 8813985