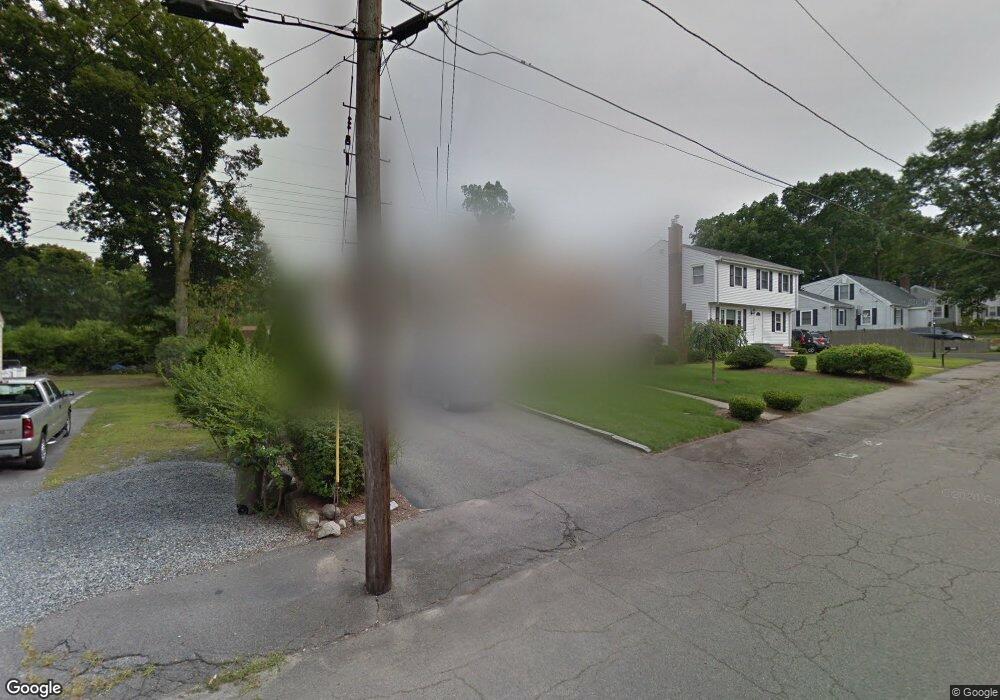
103 Belmont St Weymouth, MA 02188
South Weymouth NeighborhoodEstimated Value: $716,000 - $802,000
4
Beds
2
Baths
2,016
Sq Ft
$379/Sq Ft
Est. Value
About This Home
This home is located at 103 Belmont St, Weymouth, MA 02188 and is currently estimated at $764,382, approximately $379 per square foot. 103 Belmont St is a home located in Norfolk County with nearby schools including Frederick C Murphy, Abigail Adams Middle School, and Weymouth Middle School Chapman.
Ownership History
Date
Name
Owned For
Owner Type
Purchase Details
Closed on
Jun 14, 2007
Sold by
Frane Elaine P and Frane Thomas W
Bought by
Frane Danielle M and Frane Thomas W
Current Estimated Value
Home Financials for this Owner
Home Financials are based on the most recent Mortgage that was taken out on this home.
Original Mortgage
$264,000
Outstanding Balance
$161,540
Interest Rate
6.19%
Mortgage Type
Purchase Money Mortgage
Estimated Equity
$602,842
Create a Home Valuation Report for This Property
The Home Valuation Report is an in-depth analysis detailing your home's value as well as a comparison with similar homes in the area
Home Values in the Area
Average Home Value in this Area
Purchase History
| Date | Buyer | Sale Price | Title Company |
|---|---|---|---|
| Frane Danielle M | $330,000 | -- |
Source: Public Records
Mortgage History
| Date | Status | Borrower | Loan Amount |
|---|---|---|---|
| Open | Frane Danielle M | $264,000 |
Source: Public Records
Tax History Compared to Growth
Tax History
| Year | Tax Paid | Tax Assessment Tax Assessment Total Assessment is a certain percentage of the fair market value that is determined by local assessors to be the total taxable value of land and additions on the property. | Land | Improvement |
|---|---|---|---|---|
| 2025 | $7,965 | $788,600 | $244,600 | $544,000 |
| 2024 | $7,776 | $757,200 | $232,900 | $524,300 |
| 2023 | $7,173 | $686,400 | $215,700 | $470,700 |
| 2022 | $6,808 | $594,100 | $183,100 | $411,000 |
| 2021 | $6,409 | $545,900 | $183,100 | $362,800 |
| 2020 | $6,147 | $515,700 | $183,100 | $332,600 |
| 2019 | $6,036 | $498,000 | $176,000 | $322,000 |
| 2018 | $4,174 | $333,900 | $167,600 | $166,300 |
| 2017 | $4,049 | $316,100 | $159,700 | $156,400 |
| 2016 | $3,953 | $308,800 | $153,600 | $155,200 |
| 2015 | $3,713 | $287,800 | $146,600 | $141,200 |
| 2014 | $3,487 | $262,200 | $136,400 | $125,800 |
Source: Public Records
Map
Nearby Homes
- 116 Belmont St
- 501 Commerce Dr Unit 2310
- 501 Commerce Dr Unit 1111
- 501 Commerce Dr Unit 4206
- 501 Commerce Dr Unit 4308
- 501 Commerce Dr Unit 4306
- 655 Summer St
- 200 Justin Dr Unit 3
- 255 West St
- 262 West St
- 92 Mercury St
- 432 Grove St
- 441 Grove St
- 2 Tara Dr Unit 1
- 48 Apple Tree Ln
- 54 Federal St
- 972 Liberty St
- 308 Forest St
- 24 Blake Rd
- 2 Mitchell Ln Unit B