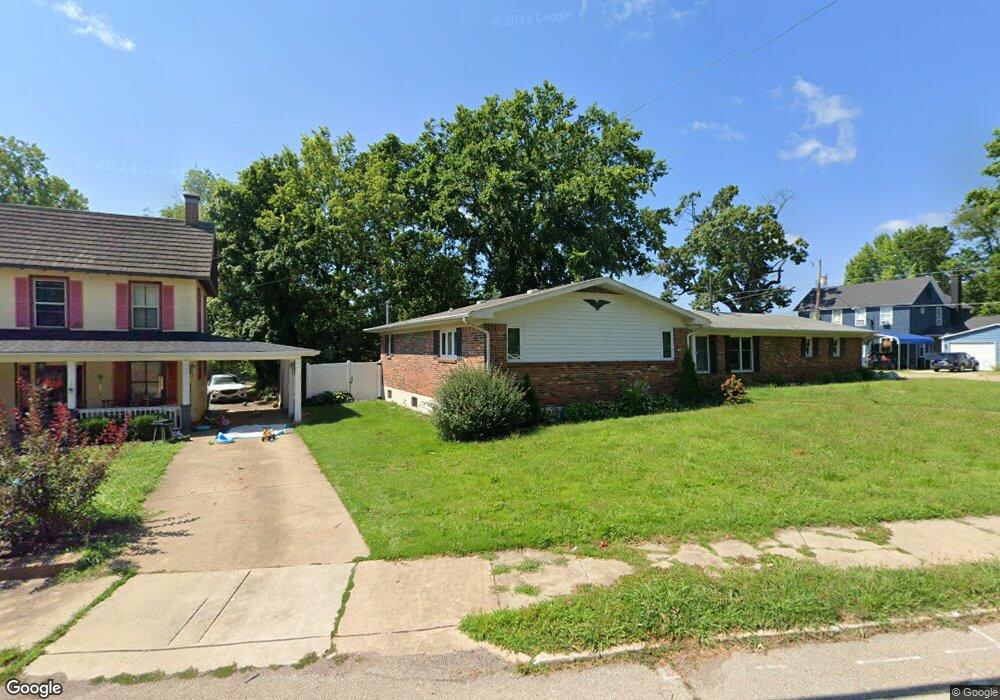
103 Benham St Bonne Terre, MO 63628
Estimated Value: $210,000 - $276,000
3
Beds
3
Baths
2,070
Sq Ft
$116/Sq Ft
Est. Value
About This Home
This home is located at 103 Benham St, Bonne Terre, MO 63628 and is currently estimated at $239,771, approximately $115 per square foot. 103 Benham St is a home located in St. Francois County with nearby schools including North County Primary School, North County Parkside Elementary School, and North County Senior High School.
Ownership History
Date
Name
Owned For
Owner Type
Purchase Details
Closed on
Feb 6, 2023
Sold by
White Lois A and White James R
Bought by
Kennedy Balley E
Current Estimated Value
Home Financials for this Owner
Home Financials are based on the most recent Mortgage that was taken out on this home.
Original Mortgage
$100,000
Outstanding Balance
$96,495
Interest Rate
6.09%
Mortgage Type
New Conventional
Estimated Equity
$143,277
Purchase Details
Closed on
Mar 22, 2019
Sold by
Virgie Morris
Bought by
White James R and White Lois A
Create a Home Valuation Report for This Property
The Home Valuation Report is an in-depth analysis detailing your home's value as well as a comparison with similar homes in the area
Home Values in the Area
Average Home Value in this Area
Purchase History
| Date | Buyer | Sale Price | Title Company |
|---|---|---|---|
| Kennedy Balley E | $125,000 | Clear Title Group Llc | |
| White James R | $135,000 | -- |
Source: Public Records
Mortgage History
| Date | Status | Borrower | Loan Amount |
|---|---|---|---|
| Open | Kennedy Balley E | $100,000 |
Source: Public Records
Tax History
| Year | Tax Paid | Tax Assessment Tax Assessment Total Assessment is a certain percentage of the fair market value that is determined by local assessors to be the total taxable value of land and additions on the property. | Land | Improvement |
|---|---|---|---|---|
| 2025 | $1,734 | $29,390 | $3,160 | $26,230 |
| 2024 | $1,524 | $25,730 | $3,160 | $22,570 |
| 2023 | $1,524 | $25,730 | $3,160 | $22,570 |
| 2022 | $1,535 | $25,730 | $3,160 | $22,570 |
| 2021 | $1,533 | $25,730 | $3,160 | $22,570 |
| 2020 | $1,527 | $25,420 | $2,850 | $22,570 |
| 2019 | $1,528 | $25,420 | $2,850 | $22,570 |
| 2018 | -- | $25,420 | $2,850 | $22,570 |
| 2017 | $1,391 | $25,420 | $2,850 | $22,570 |
| 2016 | $1,389 | $25,420 | $0 | $0 |
| 2015 | -- | $25,420 | $0 | $0 |
| 2014 | -- | $25,420 | $0 | $0 |
| 2013 | -- | $25,420 | $0 | $0 |
Source: Public Records
Map
Nearby Homes
Your Personal Tour Guide
Ask me questions while you tour the home.