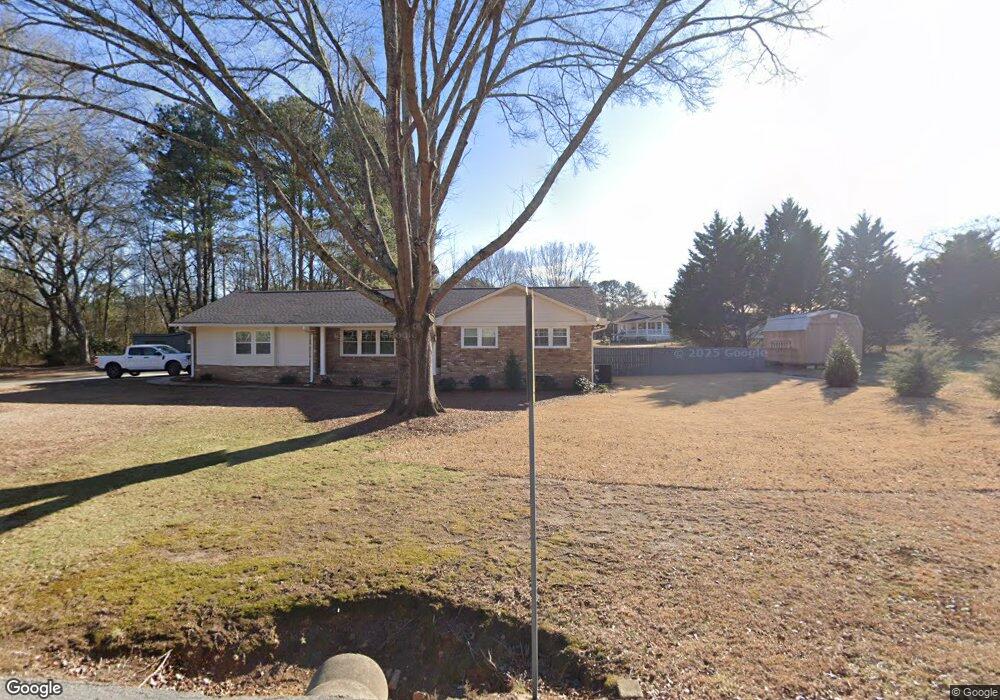
103 Benson Dr Dallas, GA 30132
Estimated Value: $222,000 - $268,000
3
Beds
2
Baths
1,272
Sq Ft
$188/Sq Ft
Est. Value
About This Home
This home is located at 103 Benson Dr, Dallas, GA 30132 and is currently estimated at $239,534, approximately $188 per square foot. 103 Benson Dr is a home located in Paulding County with nearby schools including Lillian C. Poole Elementary School, Herschel Jones Middle School, and Paulding County High School.
Ownership History
Date
Name
Owned For
Owner Type
Purchase Details
Closed on
Apr 8, 2025
Sold by
Property Directions Llc
Bought by
Bagby Investment Properties Llc
Current Estimated Value
Purchase Details
Closed on
Jan 2, 2015
Sold by
Bagby Thomas Kyle
Bought by
Directions Property Llc
Purchase Details
Closed on
Mar 19, 2013
Sold by
Eidson James Douglas Estate
Home Financials for this Owner
Home Financials are based on the most recent Mortgage that was taken out on this home.
Original Mortgage
$52,000
Interest Rate
3.57%
Mortgage Type
New Conventional
Purchase Details
Closed on
Feb 27, 2013
Sold by
Eidson Lynn C
Bought by
Eidson Lynn C
Home Financials for this Owner
Home Financials are based on the most recent Mortgage that was taken out on this home.
Original Mortgage
$52,000
Interest Rate
3.57%
Mortgage Type
New Conventional
Purchase Details
Closed on
Dec 22, 2011
Sold by
Eidson James D Estate
Purchase Details
Closed on
Dec 4, 2011
Sold by
Eidson James D
Create a Home Valuation Report for This Property
The Home Valuation Report is an in-depth analysis detailing your home's value as well as a comparison with similar homes in the area
Home Values in the Area
Average Home Value in this Area
Purchase History
| Date | Buyer | Sale Price | Title Company |
|---|---|---|---|
| Bagby Investment Properties Llc | -- | -- | |
| Directions Property Llc | -- | -- | |
| -- | -- | -- | |
| Bagby Thomas Kyle | $52,000 | -- | |
| Eidson Lynn C | -- | -- | |
| -- | -- | -- | |
| -- | -- | -- |
Source: Public Records
Mortgage History
| Date | Status | Borrower | Loan Amount |
|---|---|---|---|
| Previous Owner | Bagby Thomas Kyle | $52,000 |
Source: Public Records
Tax History Compared to Growth
Tax History
| Year | Tax Paid | Tax Assessment Tax Assessment Total Assessment is a certain percentage of the fair market value that is determined by local assessors to be the total taxable value of land and additions on the property. | Land | Improvement |
|---|---|---|---|---|
| 2024 | $2,238 | $89,956 | $7,320 | $82,636 |
| 2023 | $2,236 | $85,780 | $7,080 | $78,700 |
| 2022 | $1,907 | $73,164 | $6,120 | $67,044 |
| 2021 | $1,625 | $55,928 | $4,960 | $50,968 |
| 2020 | $1,485 | $49,988 | $5,160 | $44,828 |
| 2019 | $1,382 | $45,884 | $5,320 | $40,564 |
| 2018 | $1,131 | $37,544 | $7,560 | $29,984 |
| 2017 | $1,065 | $34,864 | $7,560 | $27,304 |
| 2016 | $820 | $27,108 | $7,200 | $19,908 |
| 2015 | $756 | $24,548 | $6,440 | $18,108 |
| 2014 | $698 | $22,108 | $6,120 | $15,988 |
| 2013 | -- | $19,760 | $7,320 | $12,440 |
Source: Public Records
Map
Nearby Homes
- 0 Cole Lake Rd Unit 7651259
- 0 Cole Lake Rd Unit 10607141
- 107 Salem Place
- 1119 W Memorial Dr
- 60 Westside Cir
- 298 Buchanan Hwy
- 380 Buchanan Hwy
- +/-1.0 Cole Lake Rd
- 361 West Ave
- 1160 W Memorial Dr
- 119 Mcbee St
- 217 Victory Dr
- 219 Briarwood Dr
- 136 Rosewood Dr
- 216 Briarwood Dr Unit 3
- 120 Remington Place Blvd
- 47 Whitley Ct
- 102 Natalie Ct
- 109 Westwood Dr
- 305 Remington Place Blvd