103 Billings Ct Fremont, IN 46737
Estimated Value: $654,000 - $1,124,442
4
Beds
3
Baths
2,344
Sq Ft
$407/Sq Ft
Est. Value
About This Home
This home is located at 103 Billings Ct, Fremont, IN 46737 and is currently estimated at $953,361, approximately $406 per square foot. 103 Billings Ct is a home located in Steuben County with nearby schools including Fremont Elementary School, Fremont Middle School, and Fremont High School.
Ownership History
Date
Name
Owned For
Owner Type
Purchase Details
Closed on
Nov 12, 2013
Sold by
Gardiner
Bought by
Rick L and Angela M
Current Estimated Value
Purchase Details
Closed on
Nov 11, 2013
Sold by
Gardiner Teresa K and Billings Larry N
Bought by
Billings Investments Llc
Create a Home Valuation Report for This Property
The Home Valuation Report is an in-depth analysis detailing your home's value as well as a comparison with similar homes in the area
Home Values in the Area
Average Home Value in this Area
Purchase History
| Date | Buyer | Sale Price | Title Company |
|---|---|---|---|
| Rick L | $460,000 | Lakeview Title Llc | |
| Billings Investments Llc | -- | None Available |
Source: Public Records
Tax History Compared to Growth
Tax History
| Year | Tax Paid | Tax Assessment Tax Assessment Total Assessment is a certain percentage of the fair market value that is determined by local assessors to be the total taxable value of land and additions on the property. | Land | Improvement |
|---|---|---|---|---|
| 2024 | $4,807 | $917,400 | $510,800 | $406,600 |
| 2023 | $4,290 | $845,500 | $468,600 | $376,900 |
| 2022 | $4,230 | $751,400 | $459,500 | $291,900 |
| 2021 | $3,603 | $654,500 | $405,600 | $248,900 |
| 2020 | $4,843 | $794,600 | $540,700 | $253,900 |
| 2019 | $3,955 | $664,100 | $434,400 | $229,700 |
| 2018 | $3,640 | $597,600 | $434,400 | $163,200 |
| 2017 | $3,656 | $596,900 | $434,400 | $162,500 |
| 2016 | $3,921 | $672,500 | $434,400 | $238,100 |
| 2014 | $3,735 | $764,500 | $589,500 | $175,000 |
| 2013 | $3,735 | $636,700 | $535,900 | $100,800 |
Source: Public Records
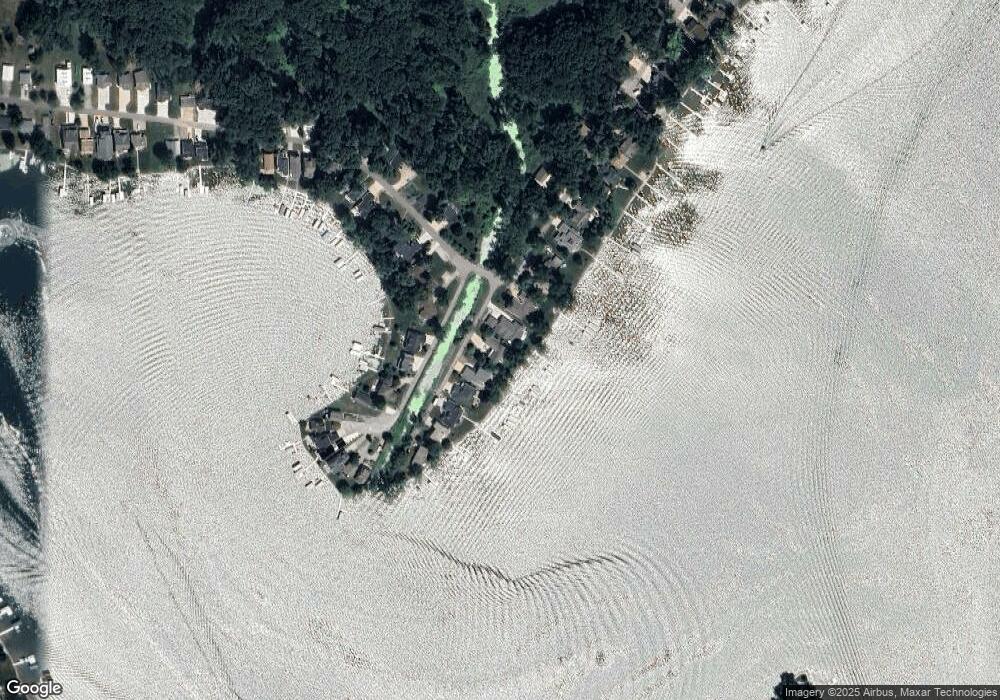
Map
Nearby Homes
- 120 Sunset Bay Ct
- 35 John Ct
- 5050 N 725 E
- 116 Chapel Avenue Clear Lake
- 6780 E 500 N
- 6430 E 784 N
- V/L Delmar Rd
- 7950 E 400 N
- 9911 Lake Dr
- 9874 Highland Dr
- 12208 Maple St
- 9677 W Camden Rd
- 00 E 400 N
- 115 N Michigan St
- 708 E Spring St
- 380 Schaeffer Ct Fish Lake
- 8833 W Territorial Rd
- 304 Hardy St
- TBD Indiana 120
- TBD Evans Dr
- 103 Billings Ct
- 101 Billings Ct
- 105 Billings Ct
- 136 W Clear Lake Dr
- 109 Billings Ct
- 102 Sunset Bay Ct
- 100 Sunset Bay Ct
- 140 W Clear Lake Dr
- 98 W Clear Lake Dr
- 142 W Clear Lake Dr
- 92 W Clear Lake Dr
- 144 W Clear Lake Dr
- 88 W Clear Lake Dr
- 106 Sunset Bay Ct
- 113 Billings Ct
- 146 W Clear Lake Dr
- 110 Sunset Bay Ct
- 86 W Clear Lake Dr
- 112 Sunset Bay Ct
- 116 Sunset Bay Ct