Estimated Value: $826,609 - $1,019,000
3
Beds
3
Baths
1,526
Sq Ft
$588/Sq Ft
Est. Value
About This Home
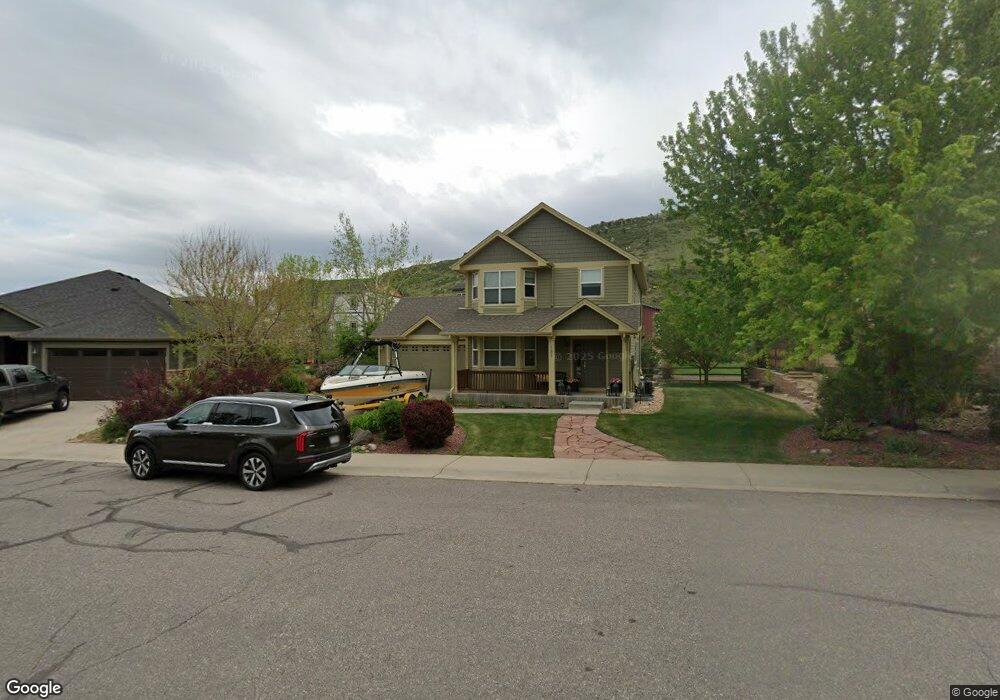
This home is located at 103 Bohn Ct, Lyons, CO 80540 and is currently estimated at $896,902, approximately $587 per square foot. 103 Bohn Ct is a home located in Boulder County with nearby schools including Lyons Elementary School and Lyons Middle/Senior High School.
Ownership History
Date
Name
Owned For
Owner Type
Purchase Details
Closed on
May 30, 2014
Sold by
Erps David E and Erps Jalyn K
Bought by
Reicks Peter W
Current Estimated Value
Home Financials for this Owner
Home Financials are based on the most recent Mortgage that was taken out on this home.
Original Mortgage
$333,600
Outstanding Balance
$254,220
Interest Rate
4.25%
Mortgage Type
Adjustable Rate Mortgage/ARM
Estimated Equity
$642,682
Purchase Details
Closed on
Mar 22, 2013
Sold by
Busch Jalyn K and Erps David E
Bought by
Erps Jalyn K
Purchase Details
Closed on
Sep 26, 2006
Sold by
Busch Jalyn K
Bought by
Busch Jalyn K
Purchase Details
Closed on
Mar 15, 2006
Sold by
Markel Homes Construction Co
Bought by
Busch Jalyn K
Home Financials for this Owner
Home Financials are based on the most recent Mortgage that was taken out on this home.
Original Mortgage
$270,782
Interest Rate
6.19%
Mortgage Type
Fannie Mae Freddie Mac
Create a Home Valuation Report for This Property
The Home Valuation Report is an in-depth analysis detailing your home's value as well as a comparison with similar homes in the area
Purchase History
| Date | Buyer | Sale Price | Title Company |
|---|---|---|---|
| Reicks Peter W | $417,000 | Land Title Guarantee Company | |
| Erps Jalyn K | -- | Land Title Guarantee Company | |
| Busch Jalyn K | -- | None Available | |
| Busch Jalyn K | $352,900 | First Colorado Title |
Source: Public Records
Mortgage History
| Date | Status | Borrower | Loan Amount |
|---|---|---|---|
| Open | Reicks Peter W | $333,600 | |
| Previous Owner | Busch Jalyn K | $270,782 |
Source: Public Records
Tax History
| Year | Tax Paid | Tax Assessment Tax Assessment Total Assessment is a certain percentage of the fair market value that is determined by local assessors to be the total taxable value of land and additions on the property. | Land | Improvement |
|---|---|---|---|---|
| 2025 | $6,530 | $53,076 | $4,113 | $48,963 |
| 2024 | $6,530 | $53,076 | $4,113 | $48,963 |
| 2023 | $6,442 | $54,907 | $3,819 | $54,773 |
| 2022 | $5,477 | $44,425 | $3,496 | $40,929 |
| 2021 | $5,411 | $45,702 | $3,596 | $42,106 |
| 2020 | $4,709 | $39,404 | $9,152 | $30,252 |
| 2019 | $4,615 | $39,404 | $9,152 | $30,252 |
| 2018 | $3,994 | $34,783 | $9,216 | $25,567 |
| 2017 | $3,928 | $38,455 | $10,189 | $28,266 |
| 2016 | $3,946 | $34,021 | $8,836 | $25,185 |
| 2015 | $3,752 | $27,001 | $4,060 | $22,941 |
| 2014 | $2,799 | $27,001 | $4,060 | $22,941 |
Source: Public Records
Map
Nearby Homes
- 334 Mcconnell Dr
- 104 Noland Ct
- 430 Carter Dr
- 400 Carter Dr
- 350 Mcconnell Dr
- 270 County Road 69
- 121 Osprey Ln
- 342 4th Ave
- 618 Overlook Dr
- 157 Stone Canyon Dr
- 240 Main St
- 17667 Route 7
- 18673 Route 7
- 245 High St
- 421 Stickney Ave
- 112 Longs Peak Dr
- 125 Longs Peak Dr
- 1040 5th Ave 2 and 4
- 1040 5th Ave 5
- 0 Apple Valley Rd
- 101 Bohn Ct
- 105 Bohn Ct
- 357 Mcconnell Dr
- 355 Mcconnell Dr
- 102 Bohn Ct
- 106 Bohn Ct
- 353 Mcconnell Dr
- 104 Bohn Ct
- 517 Goranson Ct
- 519 Goranson Ct
- 351 Mcconnell Dr
- 364 Mcconnell Dr
- 360 Mcconnell Dr
- 362 Mcconnell Dr
- 515 Goranson Ct
- 120 Noland Ct
- 358 Mcconnell Dr
- 356 Mcconnell Dr
- 122 Noland Ct
- 118 Noland Ct
Your Personal Tour Guide
Ask me questions while you tour the home.