Estimated Value: $134,038 - $235,000
--
Bed
--
Bath
1,370
Sq Ft
$137/Sq Ft
Est. Value
About This Home
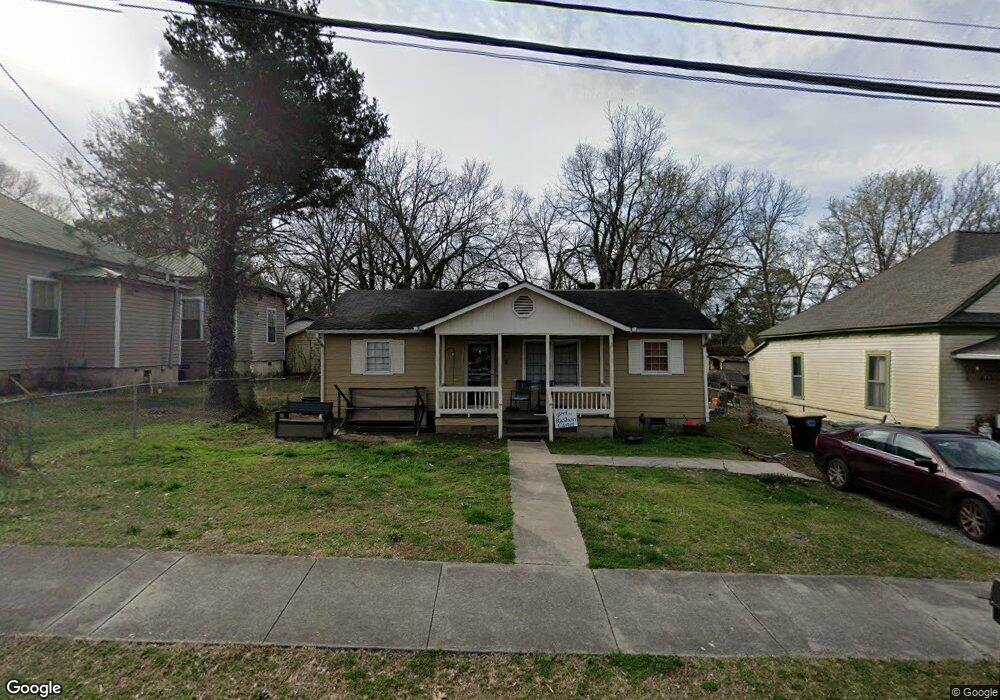
This home is located at 103 Butler St SW, Rome, GA 30161 and is currently estimated at $187,260, approximately $136 per square foot. 103 Butler St SW is a home located in Floyd County with nearby schools including Dan McCarty Middle School, Rome High School, and Darlington School.
Ownership History
Date
Name
Owned For
Owner Type
Purchase Details
Closed on
Sep 20, 1996
Sold by
Camp Paul W and Dwain Moore
Bought by
Fuller Gertrude and Maude Johnson
Current Estimated Value
Purchase Details
Closed on
Nov 20, 1987
Sold by
Fuller Gertrude and Dorothy Tate
Bought by
Camp Paul W and Dwain Moore
Purchase Details
Closed on
Aug 20, 1985
Sold by
Morgan Jackson D
Bought by
Fuller Gertrude and Dorothy Tate
Purchase Details
Closed on
Dec 14, 1977
Sold by
Morgan Jackson D and Charles Terry
Bought by
Morgan Jackson D
Purchase Details
Closed on
Jan 1, 1974
Sold by
Morgan Jackson D & Pine Log Land Co
Bought by
Morgan Jackson D and Charles Terry
Purchase Details
Closed on
Aug 15, 1973
Sold by
Morgan Jackson D and John Cooper
Bought by
Morgan Jackson D & Pine Log Land Co
Purchase Details
Closed on
Aug 2, 1973
Sold by
Berry Maybelle H
Bought by
Morgan Jackson D and John Cooper
Purchase Details
Closed on
Sep 27, 1963
Sold by
Gibson Mg Mrs Bryan Richard Maybelle
Bought by
Berry Maybelle H
Purchase Details
Closed on
Jan 1, 1901
Bought by
Gibson Mg Mrs Bryan Richard Maybell
Create a Home Valuation Report for This Property
The Home Valuation Report is an in-depth analysis detailing your home's value as well as a comparison with similar homes in the area
Home Values in the Area
Average Home Value in this Area
Purchase History
| Date | Buyer | Sale Price | Title Company |
|---|---|---|---|
| Fuller Gertrude | -- | -- | |
| Camp Paul W | -- | -- | |
| Fuller Gertrude | $29,000 | -- | |
| Morgan Jackson D | -- | -- | |
| Morgan Jackson D | -- | -- | |
| Morgan Jackson D & Pine Log Land Co | -- | -- | |
| Morgan Jackson D | -- | -- | |
| Berry Maybelle H | -- | -- | |
| Gibson Mg Mrs Bryan Richard Maybell | -- | -- |
Source: Public Records
Tax History Compared to Growth
Tax History
| Year | Tax Paid | Tax Assessment Tax Assessment Total Assessment is a certain percentage of the fair market value that is determined by local assessors to be the total taxable value of land and additions on the property. | Land | Improvement |
|---|---|---|---|---|
| 2024 | $376 | $40,248 | $4,695 | $35,553 |
| 2023 | $364 | $36,367 | $4,268 | $32,099 |
| 2022 | $382 | $30,278 | $3,414 | $26,864 |
| 2021 | $390 | $27,827 | $3,414 | $24,413 |
| 2020 | $396 | $26,054 | $2,668 | $23,386 |
| 2019 | $389 | $22,918 | $2,668 | $20,250 |
| 2018 | $376 | $21,640 | $2,668 | $18,972 |
| 2017 | $366 | $21,109 | $2,668 | $18,441 |
| 2016 | $364 | $20,912 | $2,640 | $18,272 |
| 2015 | -- | $20,912 | $2,640 | $18,272 |
| 2014 | -- | $20,912 | $2,640 | $18,272 |
Source: Public Records
Map
Nearby Homes
- 107 Butler St SW
- 515 Harper Ave SW
- 18 Butler St SW
- 3 Grover St SW
- 515 S Broad St SW
- 111 Lookout Cir SW
- 113 Lookout Cir SW
- 115 Lookout Cir SW
- 529 Branham Ave SW
- 110 Cherokee St SW
- 410 Hardy Ave SW
- 3 Porter St SW
- 334 Branham Ave SW
- 232 S Broad St SW
- 105 Mary St SW
- 5 Jervis St SW
- 13 N Blanche Ave SW
- 218 Wilson Ave SW
- 101 Butler St SW
- 508 Harper Ave SW
- 510 Harper Ave SW
- 503 Pennington Ave SW
- 503 Pennington Ave SW
- 102 Butler St SW
- 509 Pennington Ave SW
- 0 Butler St Unit 8426856
- 512 Harper Ave SW
- 106 Butler St SW
- 511 Pennington Ave SW
- 416 Harper Ave SW
- 106 W Main St SW
- 514 Harper Ave SW
- 507 Harper Ave SW
- 104 W Main St SW
- 417 Pennington Ave SW
- 503 Harper Ave SW
- 414 Harper Ave SW
- 516 Harper Ave SW