Estimated Value: $329,000 - $389,000
4
Beds
3
Baths
2,720
Sq Ft
$132/Sq Ft
Est. Value
About This Home
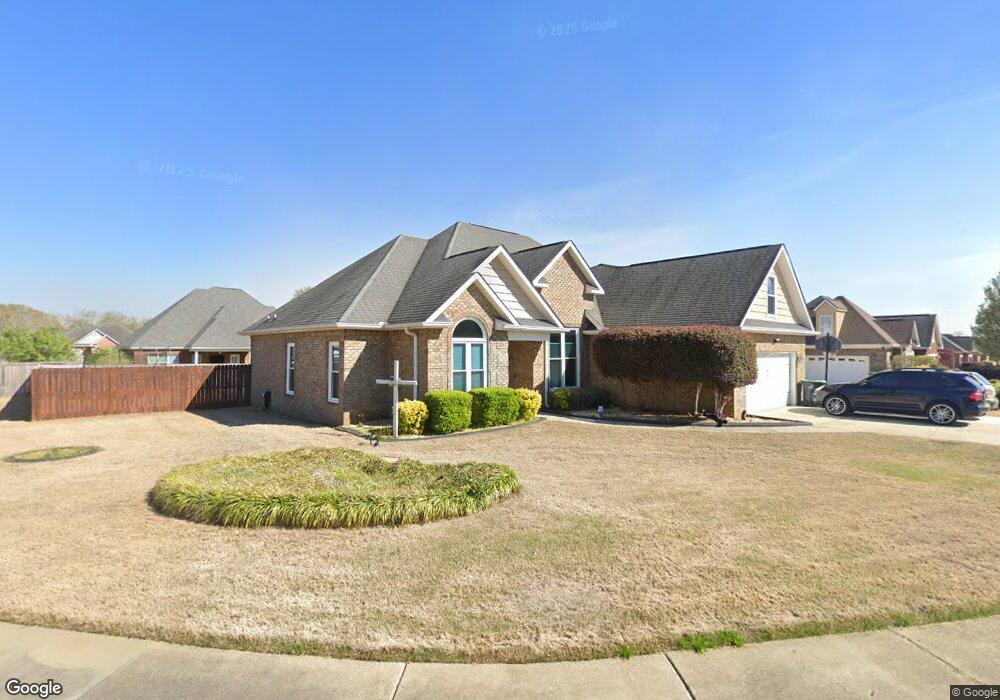
This home is located at 103 Caleb Way, Byron, GA 31008 and is currently estimated at $358,476, approximately $131 per square foot. 103 Caleb Way is a home located in Peach County with nearby schools including Byron Elementary School, Byron Middle School, and Peach County High School.
Ownership History
Date
Name
Owned For
Owner Type
Purchase Details
Closed on
Dec 8, 2010
Sold by
Federal National Mortgage Association
Bought by
Burns Richard E and Burns Tracey L
Current Estimated Value
Home Financials for this Owner
Home Financials are based on the most recent Mortgage that was taken out on this home.
Original Mortgage
$188,000
Outstanding Balance
$123,955
Interest Rate
4.18%
Mortgage Type
VA
Estimated Equity
$234,521
Purchase Details
Closed on
Aug 3, 2010
Sold by
Chase Home Finance Llc
Bought by
Federal National Mortgage Association
Purchase Details
Closed on
Feb 15, 2007
Sold by
Crisp Michael Nickolas
Bought by
Sanders Gilbert S and Sanders Patricia T
Home Financials for this Owner
Home Financials are based on the most recent Mortgage that was taken out on this home.
Original Mortgage
$187,945
Interest Rate
6.16%
Mortgage Type
New Conventional
Purchase Details
Closed on
Sep 13, 2006
Sold by
Cap Rock Investments Llc
Bought by
Crisp Michael Nickolas
Home Financials for this Owner
Home Financials are based on the most recent Mortgage that was taken out on this home.
Original Mortgage
$162,400
Interest Rate
6.48%
Mortgage Type
New Conventional
Purchase Details
Closed on
May 25, 2006
Sold by
Bayside Builders Inc
Bought by
Caprock Investments Llc
Purchase Details
Closed on
Mar 22, 2005
Sold by
Bayside Builders Inc
Bought by
Cap Rock Investments Llc
Purchase Details
Closed on
Apr 2, 2004
Sold by
Newton Development Llc
Bought by
Bayside Builders Inc
Create a Home Valuation Report for This Property
The Home Valuation Report is an in-depth analysis detailing your home's value as well as a comparison with similar homes in the area
Home Values in the Area
Average Home Value in this Area
Purchase History
| Date | Buyer | Sale Price | Title Company |
|---|---|---|---|
| Burns Richard E | -- | -- | |
| Federal National Mortgage Association | $124,700 | -- | |
| Chase Home Finance Llc | $124,700 | -- | |
| Sanders Gilbert S | $234,932 | -- | |
| Crisp Michael Nickolas | $33,000 | -- | |
| Caprock Investments Llc | -- | -- | |
| Cap Rock Investments Llc | $104,000 | -- | |
| Bayside Builders Inc | -- | -- |
Source: Public Records
Mortgage History
| Date | Status | Borrower | Loan Amount |
|---|---|---|---|
| Open | Burns Richard E | $188,000 | |
| Previous Owner | Sanders Gilbert S | $187,945 | |
| Previous Owner | Sanders Gilbert S | $46,986 | |
| Previous Owner | Crisp Michael Nickolas | $162,400 |
Source: Public Records
Tax History Compared to Growth
Tax History
| Year | Tax Paid | Tax Assessment Tax Assessment Total Assessment is a certain percentage of the fair market value that is determined by local assessors to be the total taxable value of land and additions on the property. | Land | Improvement |
|---|---|---|---|---|
| 2024 | $590 | $133,560 | $12,480 | $121,080 |
| 2023 | $802 | $132,320 | $10,000 | $122,320 |
| 2022 | $315 | $113,440 | $7,000 | $106,440 |
| 2021 | $3,900 | $96,600 | $7,000 | $89,600 |
| 2020 | $74 | $92,720 | $7,000 | $85,720 |
| 2019 | $2,909 | $92,720 | $7,000 | $85,720 |
| 2018 | $2,924 | $92,720 | $7,000 | $85,720 |
| 2017 | $2,806 | $88,560 | $7,000 | $81,560 |
| 2016 | $2,795 | $88,560 | $7,000 | $81,560 |
| 2015 | $2,799 | $88,560 | $7,000 | $81,560 |
| 2014 | $2,803 | $88,560 | $7,000 | $81,560 |
| 2013 | -- | $88,560 | $7,000 | $81,560 |
Source: Public Records
Map
Nearby Homes
- 105 Caleb Way
- 106 Carrington Ln
- 108 Carrington Ln
- 107 Caleb Way
- 104 Caleb Way
- 106 Caleb Way
- 112 Caleb Way
- 110 Caleb Way
- 110 Carrington Ln
- 114 Caleb Way
- 108 Caleb Way
- 0 Carrington Ln Unit 7392534
- 0 Carrington Ln
- 109 Caleb Way
- 116 Caleb Way
- 13 Carrington Ln
- 12 Carrington Ln
- 11 Carrington Ln
- 112 Carrington Ln
- 105 Carrington Ln