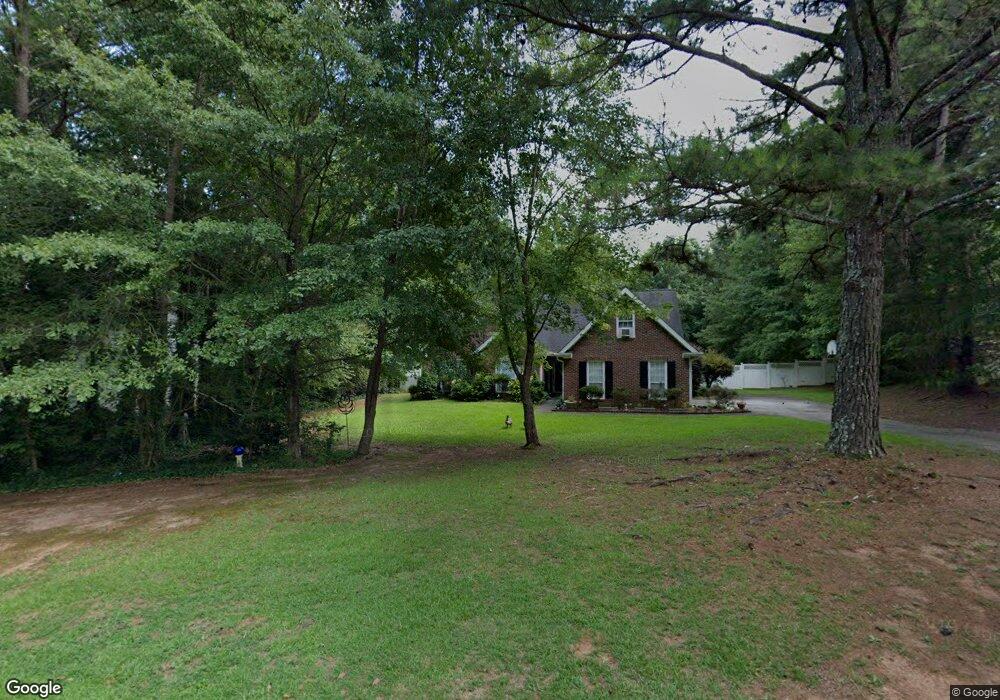
103 Camden Ln Sharpsburg, GA 30277
Estimated Value: $342,806 - $387,000
4
Beds
2
Baths
1,796
Sq Ft
$204/Sq Ft
Est. Value
About This Home
This home is located at 103 Camden Ln, Sharpsburg, GA 30277 and is currently estimated at $366,452, approximately $204 per square foot. 103 Camden Ln is a home located in Coweta County with nearby schools including Canongate Elementary School, Madras Middle School, and Northgate High School.
Ownership History
Date
Name
Owned For
Owner Type
Purchase Details
Closed on
Mar 18, 2020
Sold by
Lancaster Thomas Jonathan
Bought by
Lancaster Thomas Jonathan and Lancaster Hannah Elizabeth
Current Estimated Value
Home Financials for this Owner
Home Financials are based on the most recent Mortgage that was taken out on this home.
Original Mortgage
$191,250
Outstanding Balance
$168,687
Interest Rate
3.4%
Mortgage Type
New Conventional
Estimated Equity
$197,765
Purchase Details
Closed on
Sep 22, 2019
Sold by
Jaroszewski Judith E
Bought by
Frataccia Jill A
Purchase Details
Closed on
May 28, 2004
Sold by
Arriola Reynaldo G
Bought by
Jaroszewski John and Jaroszewski Judith
Purchase Details
Closed on
Mar 31, 1993
Bought by
Arriola Reynaldo G
Purchase Details
Closed on
Dec 22, 1992
Bought by
Davis Kenneth M
Purchase Details
Closed on
Apr 30, 1987
Bought by
Preto Claire A and Preto Bob
Create a Home Valuation Report for This Property
The Home Valuation Report is an in-depth analysis detailing your home's value as well as a comparison with similar homes in the area
Home Values in the Area
Average Home Value in this Area
Purchase History
| Date | Buyer | Sale Price | Title Company |
|---|---|---|---|
| Lancaster Thomas Jonathan | -- | -- | |
| Lancaster Thomas Jonathan | $225,000 | -- | |
| Frataccia Jill A | -- | -- | |
| Jaroszewski John | $168,100 | -- | |
| Arriola Reynaldo G | $96,000 | -- | |
| Davis Kenneth M | $16,000 | -- | |
| Preto Claire A | -- | -- |
Source: Public Records
Mortgage History
| Date | Status | Borrower | Loan Amount |
|---|---|---|---|
| Open | Lancaster Thomas Jonathan | $191,250 | |
| Closed | Lancaster Thomas Jonathan | $191,250 |
Source: Public Records
Tax History Compared to Growth
Tax History
| Year | Tax Paid | Tax Assessment Tax Assessment Total Assessment is a certain percentage of the fair market value that is determined by local assessors to be the total taxable value of land and additions on the property. | Land | Improvement |
|---|---|---|---|---|
| 2025 | $3,083 | $128,469 | $26,000 | $102,469 |
| 2024 | $2,967 | $125,728 | $26,000 | $99,728 |
| 2023 | $2,967 | $112,921 | $22,000 | $90,921 |
| 2022 | $2,728 | $108,798 | $22,000 | $86,798 |
| 2021 | $2,191 | $81,404 | $18,000 | $63,404 |
| 2020 | $2,205 | $81,404 | $18,000 | $63,404 |
| 2019 | $669 | $67,827 | $14,000 | $53,827 |
| 2018 | $673 | $67,827 | $14,000 | $53,827 |
| 2017 | $624 | $63,341 | $14,000 | $49,341 |
| 2016 | $560 | $58,894 | $12,000 | $46,894 |
| 2015 | $533 | $58,894 | $12,000 | $46,894 |
| 2014 | -- | $47,884 | $12,000 | $35,884 |
Source: Public Records
Map
Nearby Homes
- 100 Ashland Trail
- 104 Ashland Trail
- 11 Line Creek Cir
- 110 Kylemore Pass
- 150 Kylemore Pass
- 121 Northwoods Rd
- 20 Skipton Ct
- 259 Strathmore Dr Unit 3
- 100 Clydesdale Ct
- 95 Tyler Woods Dr
- 12 Race Point Way
- 135 Crimson Ridge
- 70 N Strathmore Dr
- 40 Wenham Ln
- 25 Sycamore Way
- 200 Chaparral Trace
- 2185 Castle Lake Dr
- 319 Beaconsfield Dr
- 9 Warrior Way
- 125 Cannongate Cir
- 119 Camden Ln
- 95 Camden Ln Unit V-48
- 91 Camden Ln
- 131 Camden Ln
- 104 Camden Ln
- 104 Camden Ln Unit 56
- 122 Camden Ln
- 40 Wakehurst Ct
- 0 Camden Ln Unit 8565312
- 0 Camden Ln Unit 8208571
- 0 Camden Ln Unit 7636730
- 0 Camden Ln Unit 7378902
- 0 Camden Ln Unit 7182161
- 0 Camden Ln Unit 7396969
- 0 Camden Ln
- 30 Wakehurst Ct
- 75 Camden Ln
- 86 Camden Ln
- 135 Camden Ln
- 45 Wakehurst Ct