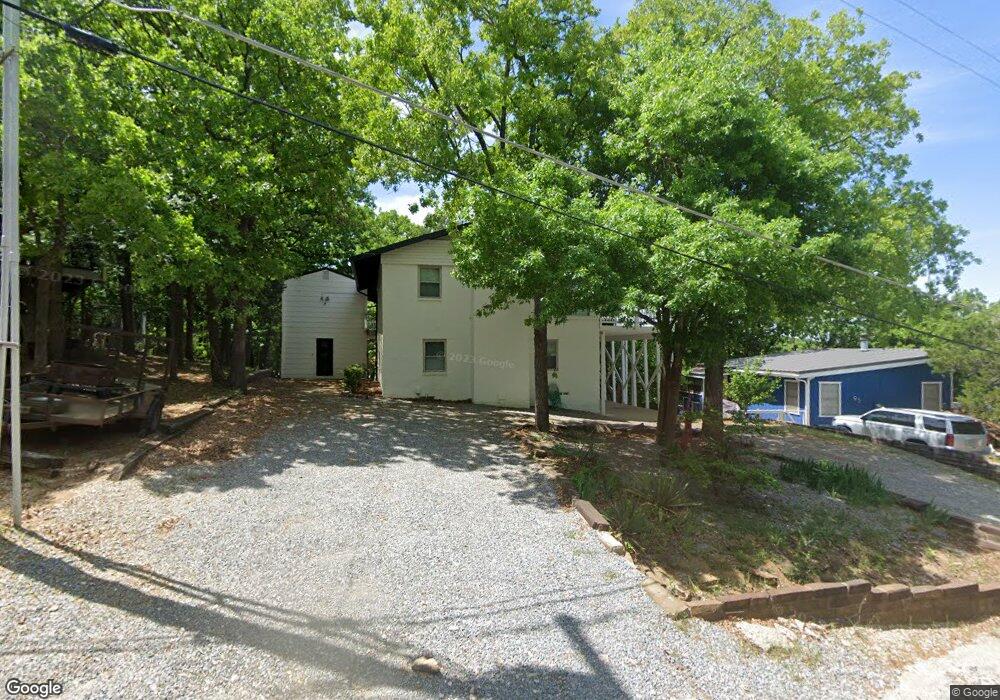
103 Cantebury Ln Pottsboro, TX 75076
Estimated Value: $391,032 - $506,000
--
Bed
--
Bath
2,212
Sq Ft
$211/Sq Ft
Est. Value
About This Home
This home is located at 103 Cantebury Ln, Pottsboro, TX 75076 and is currently estimated at $467,008, approximately $211 per square foot. 103 Cantebury Ln is a home located in Grayson County with nearby schools including Pottsboro Elementary School, Pottsboro Middle School, and Pottsboro High School.
Ownership History
Date
Name
Owned For
Owner Type
Purchase Details
Closed on
Oct 16, 2025
Sold by
Savoy Development & Acquisitions Llc
Bought by
Texoma Sands Properties Llc
Current Estimated Value
Home Financials for this Owner
Home Financials are based on the most recent Mortgage that was taken out on this home.
Original Mortgage
$366,000
Outstanding Balance
$366,000
Interest Rate
6.35%
Mortgage Type
New Conventional
Estimated Equity
$101,008
Purchase Details
Closed on
Mar 16, 2022
Sold by
Boysen and Sheri
Bought by
Savoy Development & Acquisitions Llc
Create a Home Valuation Report for This Property
The Home Valuation Report is an in-depth analysis detailing your home's value as well as a comparison with similar homes in the area
Home Values in the Area
Average Home Value in this Area
Purchase History
| Date | Buyer | Sale Price | Title Company |
|---|---|---|---|
| Texoma Sands Properties Llc | -- | Independence Title | |
| Savoy Development & Acquisitions Llc | -- | None Listed On Document |
Source: Public Records
Mortgage History
| Date | Status | Borrower | Loan Amount |
|---|---|---|---|
| Open | Texoma Sands Properties Llc | $366,000 |
Source: Public Records
Tax History Compared to Growth
Tax History
| Year | Tax Paid | Tax Assessment Tax Assessment Total Assessment is a certain percentage of the fair market value that is determined by local assessors to be the total taxable value of land and additions on the property. | Land | Improvement |
|---|---|---|---|---|
| 2025 | $5,361 | $386,687 | $88,027 | $298,660 |
| 2024 | $5,361 | $386,945 | $93,896 | $293,049 |
| 2023 | $4,880 | $351,673 | $51,747 | $299,926 |
| 2022 | $5,904 | $375,148 | $41,725 | $333,423 |
| 2021 | $3,748 | $230,496 | $28,250 | $202,246 |
| 2020 | $3,380 | $200,196 | $29,475 | $170,721 |
| 2019 | $3,689 | $208,507 | $33,150 | $175,357 |
| 2018 | $3,277 | $182,893 | $25,800 | $157,093 |
| 2017 | $3,053 | $168,189 | $25,800 | $142,389 |
| 2016 | $3,057 | $168,422 | $25,800 | $142,622 |
| 2015 | $2,782 | $150,582 | $25,800 | $124,782 |
| 2014 | -- | $146,093 | $25,800 | $120,293 |
Source: Public Records
Map
Nearby Homes
- 33 Queens Dr
- 219 Ray Rd
- 83 Mayfield Ln
- 11 Mayfield Ln
- 491 Black Forest Dr
- 545 Black Forest Dr
- 16 Wales Dr
- 226 Cambridge Dr
- 142 Wales Dr
- 191 Black Forest Dr
- 344 Castle Dr
- 81 Windsor Dr
- 207 Wales Dr
- 34 Cambridge Dr
- 110 Eagleview Cir
- 120 Eagleview Cir
- 105 Eagleview Cir
- 258 Lou-Sand Hill Rd
- 116 Oak Hills Dr
- 766 Lakepoint Loop