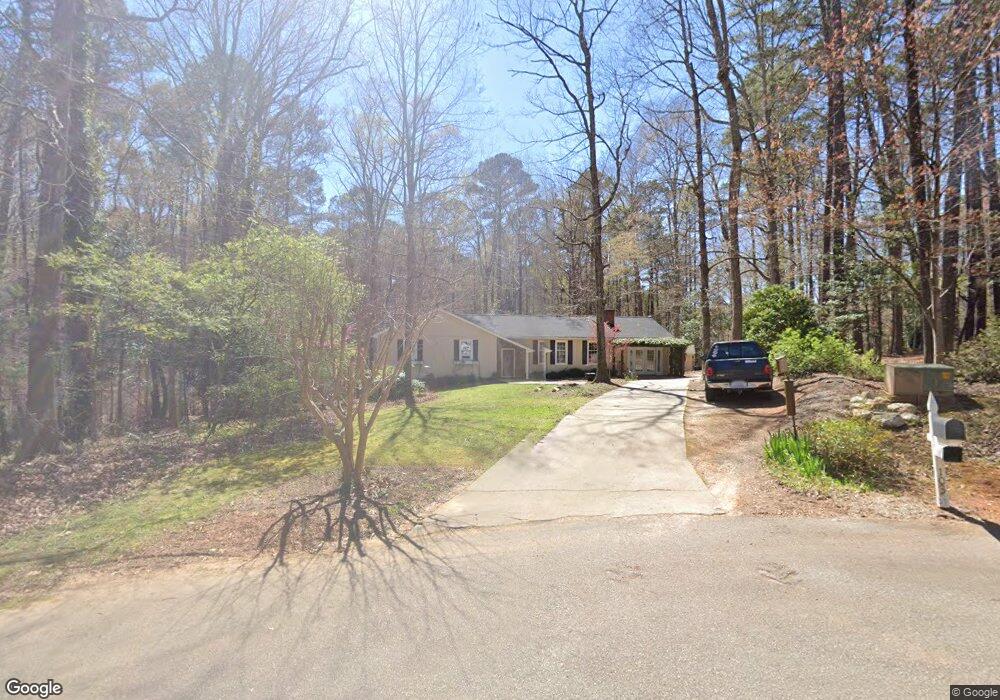
103 Cary Ct Apex, NC 27539
Middle Creek NeighborhoodEstimated Value: $458,000 - $555,808
3
Beds
2
Baths
2,150
Sq Ft
$245/Sq Ft
Est. Value
About This Home
This home is located at 103 Cary Ct, Apex, NC 27539 and is currently estimated at $527,202, approximately $245 per square foot. 103 Cary Ct is a home located in Wake County with nearby schools including Yates Mill Elementary School, Dillard Drive Magnet Middle School, and Middle Creek High.
Ownership History
Date
Name
Owned For
Owner Type
Purchase Details
Closed on
Oct 26, 2021
Sold by
Clement Daniel J and Clement Patricia M
Bought by
Smith Scott Royal and 103 Cary Court Trust
Current Estimated Value
Purchase Details
Closed on
Oct 28, 2004
Sold by
Sluder Christopher N and Gagliardi Rebecca S
Bought by
Clement Daniel J and Clement Patricia M
Home Financials for this Owner
Home Financials are based on the most recent Mortgage that was taken out on this home.
Original Mortgage
$120,000
Interest Rate
5.64%
Mortgage Type
Purchase Money Mortgage
Purchase Details
Closed on
Apr 30, 2001
Sold by
Waser David C
Bought by
Sluder Christopher N and Gagliardi Rebecca S
Home Financials for this Owner
Home Financials are based on the most recent Mortgage that was taken out on this home.
Original Mortgage
$158,644
Interest Rate
6.98%
Mortgage Type
FHA
Create a Home Valuation Report for This Property
The Home Valuation Report is an in-depth analysis detailing your home's value as well as a comparison with similar homes in the area
Home Values in the Area
Average Home Value in this Area
Purchase History
| Date | Buyer | Sale Price | Title Company |
|---|---|---|---|
| Smith Scott Royal | -- | None Available | |
| Clement Daniel J | $195,000 | -- | |
| Sluder Christopher N | $160,000 | -- |
Source: Public Records
Mortgage History
| Date | Status | Borrower | Loan Amount |
|---|---|---|---|
| Previous Owner | Clement Daniel J | $120,000 | |
| Previous Owner | Sluder Christopher N | $158,644 |
Source: Public Records
Tax History
| Year | Tax Paid | Tax Assessment Tax Assessment Total Assessment is a certain percentage of the fair market value that is determined by local assessors to be the total taxable value of land and additions on the property. | Land | Improvement |
|---|---|---|---|---|
| 2025 | $2,964 | $460,313 | $200,000 | $260,313 |
| 2024 | $2,879 | $460,313 | $200,000 | $260,313 |
Source: Public Records
Map
Nearby Homes
- 1449 Commons Ford Place
- 3733 Crooked Brook Trail
- 3805 Crooked Brook Trail
- 2117 Bee Cave Ct
- 6001 Atkins Farm Ct
- 1305 Commons Ford Place
- 3120 Summer Oaks Dr
- 3116 Summer Oaks Dr
- 116 Vintage Hill Cir
- 3428 Hardwood Dr
- 9004 Penny Rd
- 3901 Bamburgh Ln
- 2721 Glassman Ln
- 1108 Bradshaw Ct
- 3901 Orchard Point Ct
- 3417 Birk Bluff Ct
- 3005 Greyhawk Place
- 7825 Penny Rd
- 8014 Penny Rd
- 5317 Deep Valley
- 104 Cary Ct
- 7924 Merrimac Dr
- 101 Kelly Ct
- 105 Kelly Ct
- 7925 Merrimac Dr
- 8000 Merrimac Dr
- 109 Kelly Ct
- 8016 Monitor Ct
- 5010 Cedar Glen Ct
- 7917 Merrimac Dr
- 100 Kelly Ct
- 5008 Cedar Glen Ct
- 7913 Merrimac Dr
- 3509 Creekwood Bluffs Ct
- 213 Kelly Ct
- 8008 Merrimac Dr
- 5009 Cedar Glen Ct
- 104 Kelly Ct
- 208 Kelly Ct
- 210 Kelly Ct
Your Personal Tour Guide
Ask me questions while you tour the home.