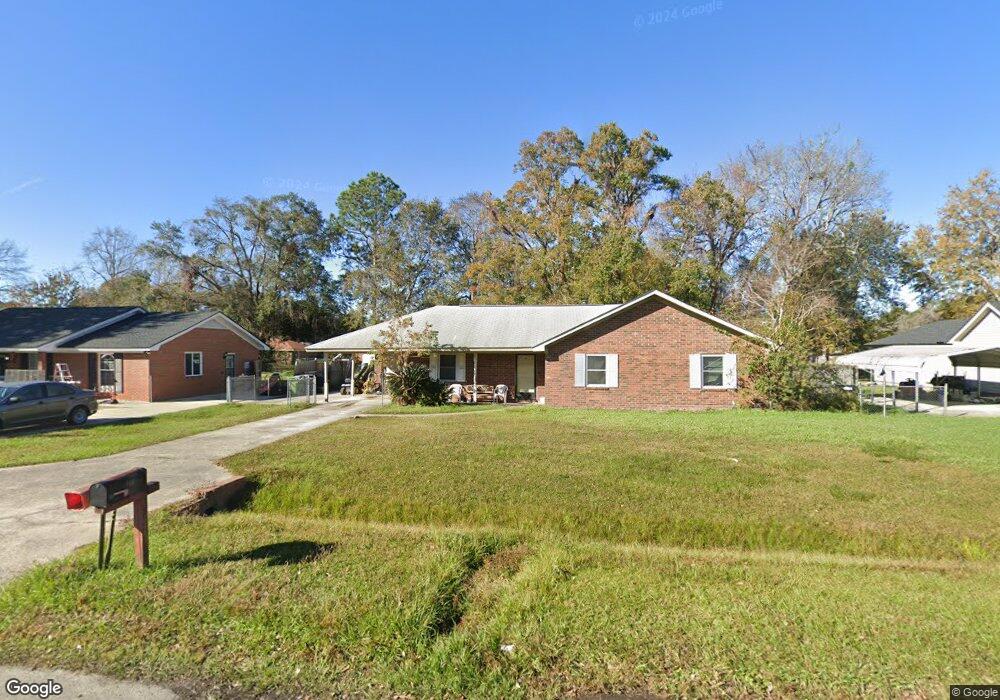
103 Cedar St Hinesville, GA 31313
Estimated Value: $200,000 - $223,000
3
Beds
2
Baths
1,381
Sq Ft
$151/Sq Ft
Est. Value
About This Home
This home is located at 103 Cedar St, Hinesville, GA 31313 and is currently estimated at $209,167, approximately $151 per square foot. 103 Cedar St is a home located in Liberty County with nearby schools including Button Gwinnett Elementary School, Snelson-Golden Middle School, and Bradwell Institute.
Ownership History
Date
Name
Owned For
Owner Type
Purchase Details
Closed on
Jun 26, 2017
Sold by
Tzen John
Bought by
Tang Yali
Current Estimated Value
Purchase Details
Closed on
Mar 1, 2017
Bought by
Tzen John
Purchase Details
Closed on
Jun 7, 2016
Sold by
James B Nutter & Co
Bought by
Federal National Mortgage Association
Purchase Details
Closed on
Jun 20, 2000
Sold by
Ohtola Karla M
Bought by
Fontes Isadore J and Fontes E
Purchase Details
Closed on
Aug 31, 1998
Sold by
Sec Vet Affairs
Bought by
Ohtola Karla M
Purchase Details
Closed on
May 6, 1997
Sold by
Regions Mtg Inc
Bought by
Sec Vet Affairs
Purchase Details
Closed on
Oct 7, 1991
Bought by
Rahney John and Rahney A
Create a Home Valuation Report for This Property
The Home Valuation Report is an in-depth analysis detailing your home's value as well as a comparison with similar homes in the area
Home Values in the Area
Average Home Value in this Area
Purchase History
| Date | Buyer | Sale Price | Title Company |
|---|---|---|---|
| Tang Yali | -- | -- | |
| Tzen John | -- | -- | |
| Federal National Mortgage Association | $91,500 | -- | |
| James B Nutter & Co | $91,500 | -- | |
| Fontes Isadore J | $64,700 | -- | |
| Ohtola Karla M | $54,100 | -- | |
| Sec Vet Affairs | -- | -- | |
| Regions Mtg Inc | $54,500 | -- | |
| Rahney John | $59,600 | -- |
Source: Public Records
Tax History Compared to Growth
Tax History
| Year | Tax Paid | Tax Assessment Tax Assessment Total Assessment is a certain percentage of the fair market value that is determined by local assessors to be the total taxable value of land and additions on the property. | Land | Improvement |
|---|---|---|---|---|
| 2024 | $3,127 | $63,590 | $14,000 | $49,590 |
| 2023 | $3,127 | $53,916 | $12,000 | $41,916 |
| 2022 | $2,006 | $42,950 | $8,000 | $34,950 |
| 2021 | $1,819 | $38,193 | $8,000 | $30,193 |
| 2020 | $1,856 | $38,626 | $8,000 | $30,626 |
| 2019 | $1,864 | $39,079 | $8,000 | $31,079 |
| 2018 | $1,855 | $39,110 | $8,000 | $31,110 |
| 2017 | $1,303 | $39,562 | $8,000 | $31,562 |
| 2016 | $1,253 | $39,592 | $8,000 | $31,592 |
| 2015 | $1,273 | $41,155 | $8,000 | $33,155 |
| 2014 | $1,273 | $39,644 | $8,000 | $31,644 |
| 2013 | -- | $36,679 | $6,800 | $29,879 |
Source: Public Records
Map
Nearby Homes