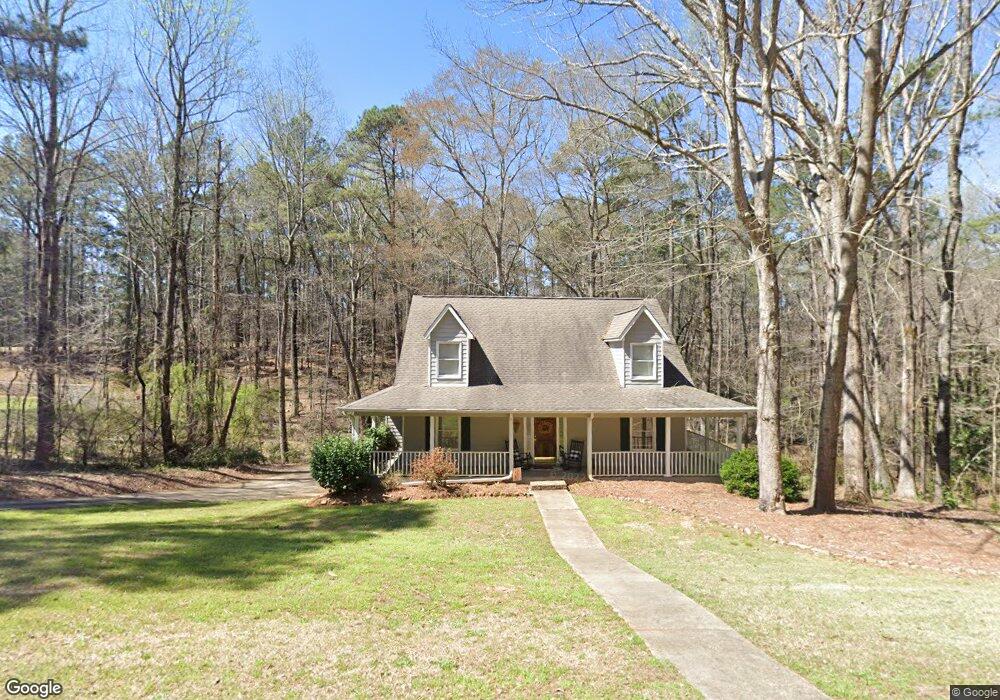
103 Chinaberry Ln Unit 12 Lagrange, GA 30240
Estimated Value: $184,000 - $277,932
3
Beds
3
Baths
1,960
Sq Ft
$108/Sq Ft
Est. Value
About This Home
This home is located at 103 Chinaberry Ln Unit 12, Lagrange, GA 30240 and is currently estimated at $211,733, approximately $108 per square foot. 103 Chinaberry Ln Unit 12 is a home located in Troup County with nearby schools including Franklin Forest Elementary School, Hollis Hand Elementary School, and Ethel W. Kight Elementary School.
Ownership History
Date
Name
Owned For
Owner Type
Purchase Details
Closed on
Jun 4, 2025
Sold by
Kraatz Dagenhart Melissa
Bought by
Lin Min Hui
Current Estimated Value
Home Financials for this Owner
Home Financials are based on the most recent Mortgage that was taken out on this home.
Original Mortgage
$173,850
Outstanding Balance
$173,701
Interest Rate
6.76%
Mortgage Type
New Conventional
Estimated Equity
$38,032
Purchase Details
Closed on
Jun 30, 2017
Sold by
Hughes Clifford W
Bought by
Kraatz Dagenhart Melissa
Home Financials for this Owner
Home Financials are based on the most recent Mortgage that was taken out on this home.
Original Mortgage
$109,971
Interest Rate
3.75%
Mortgage Type
FHA
Purchase Details
Closed on
Jan 7, 1998
Sold by
Amy Crews
Bought by
Hughes Amy C
Purchase Details
Closed on
Oct 21, 1997
Sold by
Cary Lukken Downey
Bought by
Amy Crews
Purchase Details
Closed on
Jul 3, 1993
Sold by
Walter J Lukken
Bought by
Cary Lukken Downey
Purchase Details
Closed on
Jul 2, 1993
Sold by
Deborah Ann Lukken
Bought by
Walter J Lukken
Purchase Details
Closed on
Jun 29, 1993
Sold by
Walter J Lukken Co Ex
Bought by
Deborah Ann Lukken
Purchase Details
Closed on
Mar 15, 1976
Bought by
Walter J Lukken Co Ex
Create a Home Valuation Report for This Property
The Home Valuation Report is an in-depth analysis detailing your home's value as well as a comparison with similar homes in the area
Home Values in the Area
Average Home Value in this Area
Purchase History
| Date | Buyer | Sale Price | Title Company |
|---|---|---|---|
| Lin Min Hui | $183,000 | -- | |
| Kraatz Dagenhart Melissa | $112,000 | -- | |
| Hughes Amy C | -- | -- | |
| Amy Crews | $10,000 | -- | |
| Cary Lukken Downey | -- | -- | |
| Walter J Lukken | -- | -- | |
| Deborah Ann Lukken | -- | -- | |
| Walter J Lukken Co Ex | -- | -- |
Source: Public Records
Mortgage History
| Date | Status | Borrower | Loan Amount |
|---|---|---|---|
| Open | Lin Min Hui | $173,850 | |
| Previous Owner | Kraatz Dagenhart Melissa | $109,971 |
Source: Public Records
Tax History Compared to Growth
Tax History
| Year | Tax Paid | Tax Assessment Tax Assessment Total Assessment is a certain percentage of the fair market value that is determined by local assessors to be the total taxable value of land and additions on the property. | Land | Improvement |
|---|---|---|---|---|
| 2024 | $1,924 | $70,560 | $14,000 | $56,560 |
| 2023 | $1,991 | $73,000 | $14,000 | $59,000 |
| 2022 | $1,924 | $68,920 | $14,000 | $54,920 |
| 2021 | $1,761 | $58,400 | $10,000 | $48,400 |
| 2020 | $1,761 | $58,400 | $10,000 | $48,400 |
| 2019 | $1,717 | $56,920 | $10,000 | $46,920 |
| 2018 | $1,351 | $50,920 | $4,000 | $46,920 |
| 2017 | $1,455 | $50,240 | $4,000 | $46,240 |
| 2016 | $1,434 | $49,523 | $4,000 | $45,523 |
| 2015 | $1,436 | $49,523 | $4,000 | $45,523 |
| 2014 | $1,366 | $47,127 | $4,000 | $43,127 |
| 2013 | -- | $48,386 | $4,000 | $44,386 |
Source: Public Records
Map
Nearby Homes
- 100 Creekside Dr Unit LOT 60A
- 127 Ashling Dr
- 107 Dixie Creek Dr
- 106 S Chilton Crescent
- 105 Ridgeview Dr
- 201 S Chilton Crescent
- 203 S Chilton Crescent
- 104 Hidden Branches Ln
- 127 Oakmont Dr
- 89 Chase Rd
- 724 Camellia Dr
- 106 Ewing St
- 102 Ewing St
- 118 Moss Creek Dr
- 91 Richmond Dr
- 134 S Page St
- LOT 106 River Oaks Dr
- 114 Briarcliff Rd
- 204 Colonial St
- 806 New Franklin Rd
- 0 Chinaberry Ln Unit 7094196
- 0 Chinaberry Ln Unit 8357197
- 0 Chinaberry Ln Unit 7538965
- 0 Chinaberry Ln
- 101 Chinaberry Ln
- 105 Chinaberry Ln
- 100 Chinaberry Ln
- 100 Sweetgum Dr
- 102 Sweetgum Dr
- 1518 Mooty Bridge Rd
- 104 Chinaberry Ln
- 107 Chinaberry Ln
- 0 Sweetgum Dr Unit 8698900
- 0 Sweetgum Dr Unit 8731278
- 0 Sweetgum Dr Unit 8584588
- 0 Sweetgum Dr Unit 8557805
- 101 Sweetgum Dr
- 1504 Mooty Bridge Rd
- 104 Sweetgum Dr Unit 8
- 104 Sweetgum Dr