Estimated Value: $197,742 - $219,000
3
Beds
3
Baths
1,450
Sq Ft
$141/Sq Ft
Est. Value
About This Home
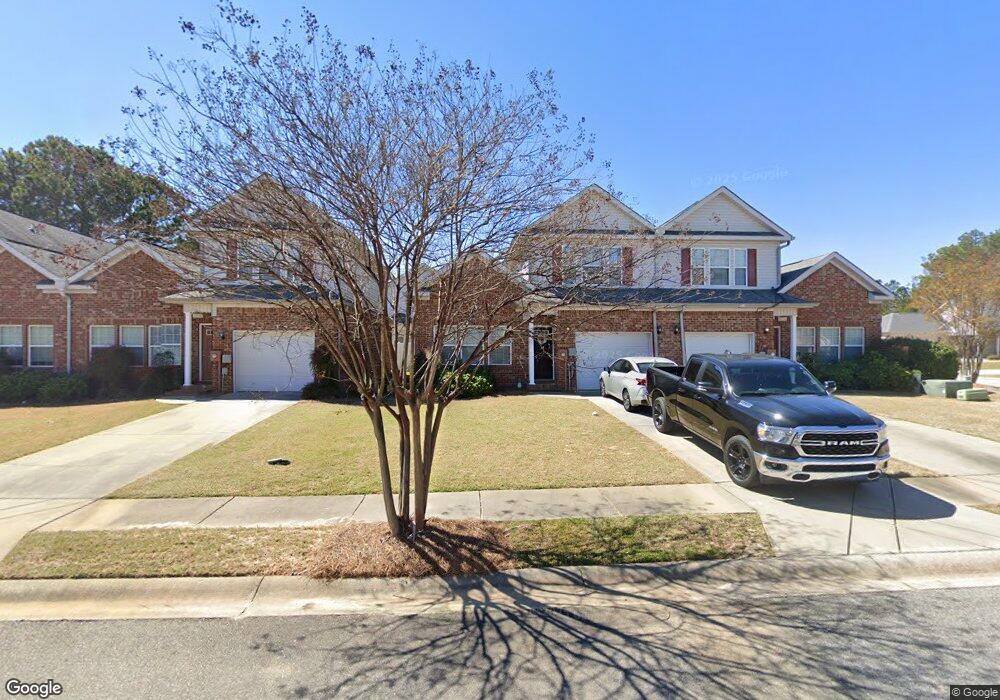
This home is located at 103 Cottage Cir Unit 103, Byron, GA 31008 and is currently estimated at $204,686, approximately $141 per square foot. 103 Cottage Cir Unit 103 is a home located in Peach County with nearby schools including Byron Elementary School, Byron Middle School, and Peach County High School.
Ownership History
Date
Name
Owned For
Owner Type
Purchase Details
Closed on
Jul 18, 2014
Sold by
Cbna Ga Ii Llc
Bought by
Ottinger Jeremy
Current Estimated Value
Home Financials for this Owner
Home Financials are based on the most recent Mortgage that was taken out on this home.
Original Mortgage
$72,675
Outstanding Balance
$55,522
Interest Rate
4.24%
Mortgage Type
New Conventional
Estimated Equity
$149,164
Purchase Details
Closed on
Sep 3, 2013
Sold by
Y & Y Enterprises Inc
Bought by
Cbna Ga Ii Llc
Purchase Details
Closed on
Jul 18, 2013
Sold by
Cbna-Ga Ii Llc
Bought by
Ottinger Jeremy
Purchase Details
Closed on
Feb 8, 2007
Sold by
Timber Ridge Preserve Inc
Bought by
Y & Y Enterprises Inc
Home Financials for this Owner
Home Financials are based on the most recent Mortgage that was taken out on this home.
Original Mortgage
$107,600
Interest Rate
6.17%
Mortgage Type
New Conventional
Purchase Details
Closed on
Aug 30, 2004
Bought by
Timber Ridge Preserve Inc
Create a Home Valuation Report for This Property
The Home Valuation Report is an in-depth analysis detailing your home's value as well as a comparison with similar homes in the area
Home Values in the Area
Average Home Value in this Area
Purchase History
| Date | Buyer | Sale Price | Title Company |
|---|---|---|---|
| Ottinger Jeremy | $76,500 | -- | |
| Cbna Ga Ii Llc | $85,000 | -- | |
| Ottinger Jeremy | $76,500 | -- | |
| Y & Y Enterprises Inc | -- | -- | |
| Timber Ridge Preserve Inc | -- | -- |
Source: Public Records
Mortgage History
| Date | Status | Borrower | Loan Amount |
|---|---|---|---|
| Open | Ottinger Jeremy | $72,675 | |
| Previous Owner | Y & Y Enterprises Inc | $107,600 |
Source: Public Records
Tax History Compared to Growth
Tax History
| Year | Tax Paid | Tax Assessment Tax Assessment Total Assessment is a certain percentage of the fair market value that is determined by local assessors to be the total taxable value of land and additions on the property. | Land | Improvement |
|---|---|---|---|---|
| 2024 | $2,300 | $64,440 | $7,240 | $57,200 |
| 2023 | $2,272 | $63,240 | $5,800 | $57,440 |
| 2022 | $1,512 | $56,160 | $5,800 | $50,360 |
| 2021 | $1,274 | $40,800 | $3,200 | $37,600 |
| 2020 | $1,249 | $40,000 | $3,200 | $36,800 |
| 2019 | $1,255 | $40,000 | $3,200 | $36,800 |
| 2018 | $1,261 | $40,000 | $3,200 | $36,800 |
| 2017 | $1,268 | $40,000 | $3,200 | $36,800 |
| 2016 | $1,351 | $42,800 | $6,000 | $36,800 |
| 2015 | -- | $42,800 | $6,000 | $36,800 |
| 2014 | $1,152 | $42,800 | $6,000 | $36,800 |
| 2013 | -- | $42,800 | $6,000 | $36,800 |
Source: Public Records
Map
Nearby Homes
- 234 Cottage Cir
- 124 Timber Ridge Blvd
- 231 W Seminole Dr
- 293 Osage Cir
- 467 Kirkland Dr
- 203 Colonial Dr
- 104 Robinson St
- 109 Silver Maple Ct
- 204 Sugar Maple Ct
- 107 Silver Maple Ct
- 102 Silver Maple Ct
- 506 Howard St
- 110 Pine Crest Dr
- 2251 Boy Scout Rd
- 133 Peach Rd
- 101 Fawn Ct
- 103 Fawn Ct
- 00 Dunbar Rd
- 211 Coastal Dr
- 214 Coastal Dr
- 103 Cottage Cir
- 100 Cottage Cir
- 101 Cottage Cir
- 105 Cottage Cir
- 107 Cottage Cir
- 503 Station Square Dr
- 501 Station Square Dr
- 401 Station Square Dr
- 109 Cottage Cir
- 402 Station Square Dr
- 403 Station Square Dr
- 102 Cottage Cir
- 104 Cottage Cir
- 106 Cottage Cir
- 108 Cottage Cir
- 200 Cottage Cir
- 202 Cottage Cir
- 109 Station Square Dr
- 111 Station Square Dr
- 116 Station Square Dr