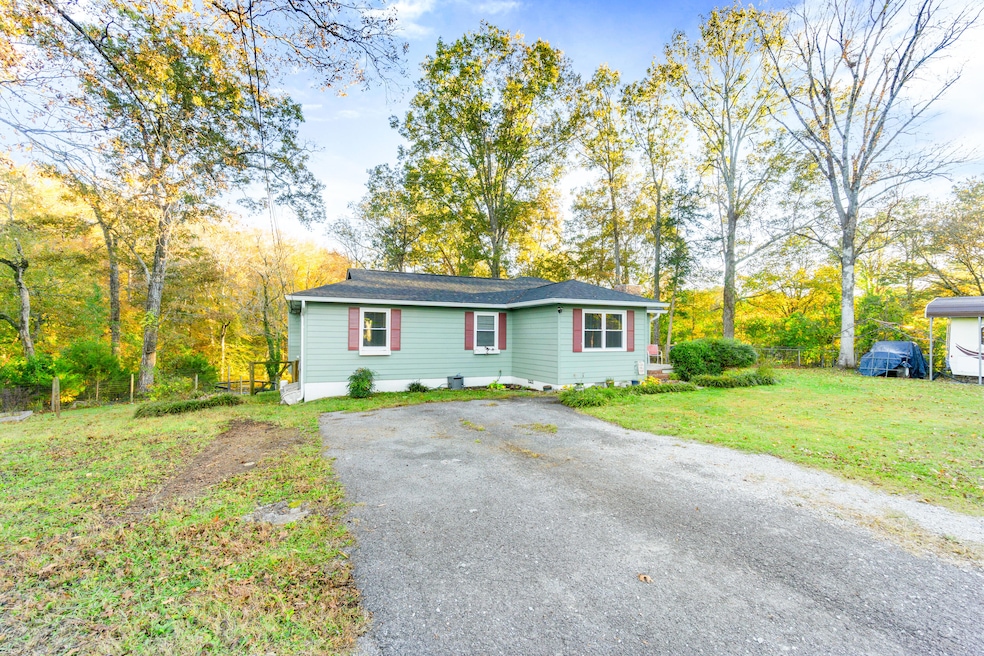
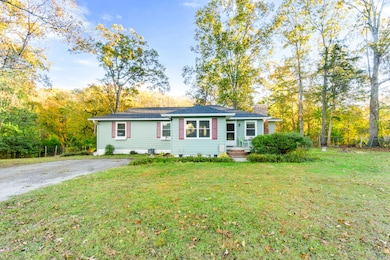
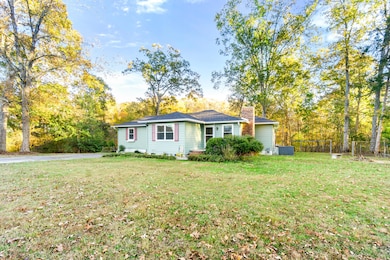
103 Cross St Chickamauga, GA 30707
Estimated payment $1,476/month
Highlights
- Very Popular Property
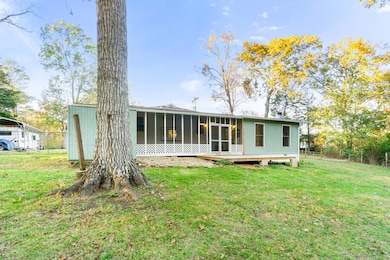
- Home fronts a creek
- RV or Boat Parking
- Docks
- Fishing
- Creek or Stream View
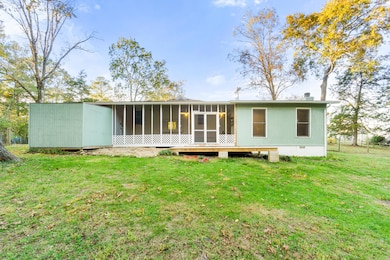
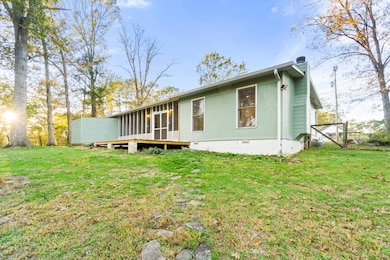
About This Home
Well-maintained 3 BR/2BA home on the Chickamauga creek. Features large den with fireplace and waterview, screened porch, fenced back yard, 2 fireplaces, and a private dock. Roof, HVAC, windows, and water heater have all been replaced in the last 5 years. Brand new appliances, including gas stove. Move-in ready and beautifully updated! Convenient location; 10 minutes to Fort Oglethorpe, 25 minutes to downtown Chattanooga, 2 hours from Atlanta. Eligible for 100% USDA financing.

Home Details
Home Type
- Single Family
Est. Annual Taxes
- $1,274
Year Built
- Built in 1957 | Remodeled
Lot Details
- 0.65 Acre Lot
- Lot Dimensions are 165x171
- Home fronts a creek
- Property fronts a county road
- Chain Link Fence
- Back Yard Fenced
Home Design
- Block Foundation
- Shingle Roof
- Wood Siding
Interior Spaces
- 1,635 Sq Ft Home
- 1-Story Property
- Ceiling Fan
- Wood Burning Fireplace
- Self Contained Fireplace Unit Or Insert
- Gas Log Fireplace
- Vinyl Clad Windows
- Family Room with Fireplace
- 2 Fireplaces
- Living Room with Fireplace
- Formal Dining Room
- Den
- Screened Porch
- Storage
- Creek or Stream Views
Kitchen
- Gas Cooktop
- Dishwasher
Flooring
- Vinyl Plank
- Vinyl
Bedrooms and Bathrooms
- 3 Bedrooms
- Split Bedroom Floorplan
- En-Suite Bathroom
- 2 Full Bathrooms
- Bathtub with Shower
Laundry
- Laundry on main level
- Washer and Electric Dryer Hookup
Parking
- 1 Carport Space
- Driveway
- Paved Parking
- Off-Street Parking
- RV or Boat Parking
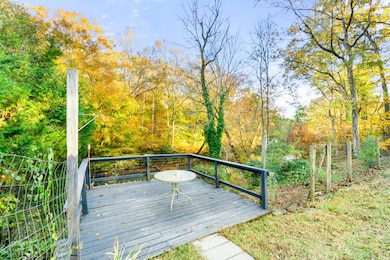
Outdoor Features
- Docks
- Deck
- Fire Pit
- Shed
- Outbuilding
- Rain Gutters
Schools
- Cherokee Ridge Elementary School
- Rossville Middle School
- Ridgeland High School
Utilities
- Dehumidifier
- Central Heating
- Gas Available
- Water Heater
- High Speed Internet
- Phone Available
Listing and Financial Details
- Assessor Parcel Number 0220 003
Community Details
Overview
- No Home Owners Association
- Fair Acres Subdivision
Recreation
- Fishing
Security
- Building Fire Alarm
Map
Home Values in the Area
Average Home Value in this Area
Tax History
| Year | Tax Paid | Tax Assessment Tax Assessment Total Assessment is a certain percentage of the fair market value that is determined by local assessors to be the total taxable value of land and additions on the property. | Land | Improvement |
|---|---|---|---|---|
| 2024 | $1,496 | $62,728 | $6,000 | $56,728 |
| 2023 | $1,460 | $59,780 | $6,000 | $53,780 |
| 2022 | $1,374 | $52,357 | $6,000 | $46,357 |
| 2021 | $1,268 | $43,157 | $6,000 | $37,157 |
| 2020 | $1,082 | $36,907 | $6,000 | $30,907 |
| 2019 | $884 | $29,839 | $6,000 | $23,839 |
| 2018 | $993 | $37,547 | $13,708 | $23,839 |
| 2017 | $1,198 | $37,547 | $13,708 | $23,839 |
| 2016 | $935 | $34,895 | $11,056 | $23,839 |
| 2015 | $787 | $27,241 | $6,864 | $20,377 |
| 2014 | $702 | $27,241 | $6,864 | $20,377 |
| 2013 | -- | $27,240 | $6,864 | $20,376 |
Property History
| Date | Event | Price | List to Sale | Price per Sq Ft |
|---|---|---|---|---|
| 11/10/2025 11/10/25 | For Sale | $260,000 | -- | $159 / Sq Ft |
Purchase History
| Date | Type | Sale Price | Title Company |
|---|---|---|---|
| Warranty Deed | $86,520 | -- | |
| Warranty Deed | -- | -- | |
| Deed | $81,900 | -- | |
| Deed | $72,900 | -- | |
| Deed | $16,400 | -- | |
| Deed | -- | -- |
Mortgage History
| Date | Status | Loan Amount | Loan Type |
|---|---|---|---|
| Open | $87,393 | New Conventional |
Source: Greater Chattanooga REALTORS®
MLS Number: 1523736
APN: 0220-003
Disclaimer: Certain information contained herein is derived from information provided by parties other than Homes.com. All information provided is deemed reliable, but is not guaranteed to be accurate and should be independently verified.
![]() IDX information is provided exclusively for consumers’ personal, noncommercial use, that it may not be used for any purpose other than to identify prospective properties consumers may be interested in purchasing.
IDX information is provided exclusively for consumers’ personal, noncommercial use, that it may not be used for any purpose other than to identify prospective properties consumers may be interested in purchasing.
Data is deemed reliable but is not guaranteed accurate by the MLS.
Ten-X does not display the entire MLS of Chattanooga, Inc. database on this website. The listings of some real estate brokerage firms have been excluded. Some or all of the listings displayed may not belong to the firm whose website is being visited
Copyright© 2025 by Chattanooga Association of REALTORS®
- 309 Longwood St
- 12768 U S 27
- 5 S Orchard Dr
- 910 Crittenden Ave
- 8 W 8th St
- 234 Wilder Rd
- 100 Arlington Dr
- 94 Arlington Dr
- 84 Arlington Dr
- 80 Arlington Dr
- 162 Bending Oak Dr
- 190 Sycamore Dr
- 309 E 16th St
- Southport Plan at Cambridge Cove
- Aria Plan at Cambridge Cove
- Bayshore Plan at Cambridge Cove
- 16 Euclid Ave
- 107 Wilder Ave
- 44 Bending Oak Dr
- 74 Sycamore Dr
- 324 Avenue of The Oaks
- 1185 Johnson Rd Unit Johnson
- 213 Hilltop Dr
- 22 Ridgeland Cir
- 1000 Lakeshore Dr
- 1100 Lakeshore Dr
- 506a N Thomas Rd
- 2212 S Cedar Ln
- 57 Tranquility Dr
- 40 Cottage Dr
- 304 Fort Town Dr
- 50 General Davis Rd
- 1252 Cloud Springs Ln
- 35 Savannah Way Unit 41Ashton
- 1418 Baggett Rd Unit 1490
- 3434 Boynton Dr
- 100 Brookhaven Cir
- 14 Bunker Dr
- 327 Draft St
- 10 Draught St