Estimated Value: $204,000 - $280,000
3
Beds
2
Baths
2,000
Sq Ft
$124/Sq Ft
Est. Value
About This Home
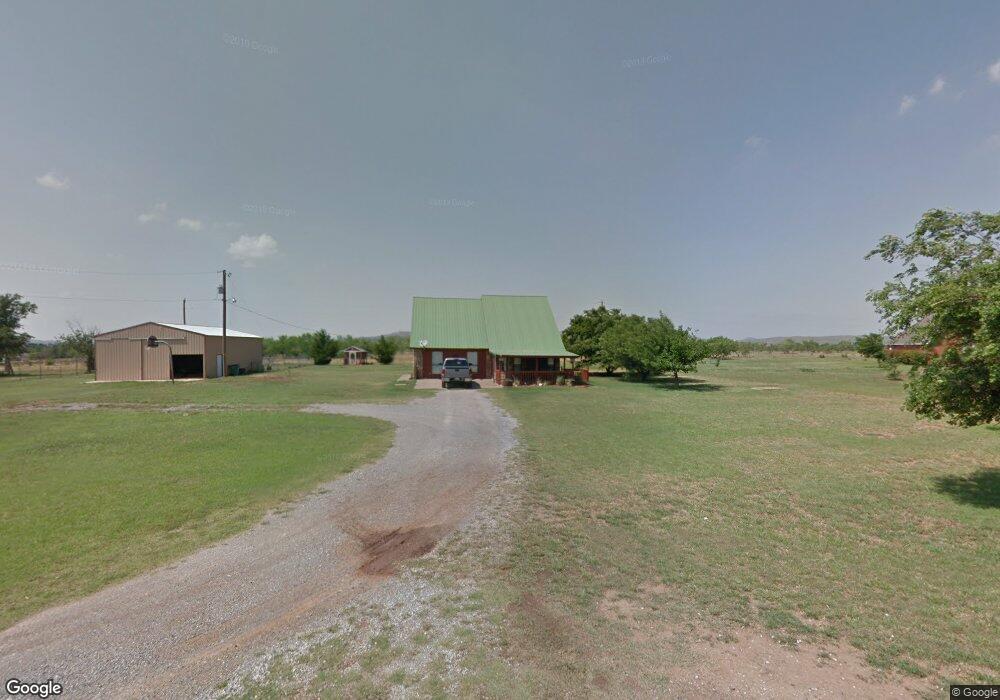
This home is located at 103 Deacons Row, Cache, OK 73527 and is currently estimated at $247,454, approximately $123 per square foot. 103 Deacons Row is a home located in Comanche County with nearby schools including Cache Primary Elementary School, Cache Intermediate Elementary School, and Cache Middle School.
Ownership History
Date
Name
Owned For
Owner Type
Purchase Details
Closed on
Jun 15, 2012
Sold by
Davis Darcy E and Davis Tina M
Bought by
Eppes Jonathan D and Eppes Brtney
Current Estimated Value
Home Financials for this Owner
Home Financials are based on the most recent Mortgage that was taken out on this home.
Original Mortgage
$168,500
Outstanding Balance
$116,110
Interest Rate
3.86%
Mortgage Type
VA
Estimated Equity
$131,344
Purchase Details
Closed on
Feb 18, 2010
Sold by
Adams Lawrence A and Adams Pamela L
Bought by
Davis Darcy E and Davis Tina M
Home Financials for this Owner
Home Financials are based on the most recent Mortgage that was taken out on this home.
Original Mortgage
$154,846
Interest Rate
5.11%
Mortgage Type
VA
Purchase Details
Closed on
Sep 3, 2004
Sold by
Kriss Charles E and Kriss Donna
Create a Home Valuation Report for This Property
The Home Valuation Report is an in-depth analysis detailing your home's value as well as a comparison with similar homes in the area
Home Values in the Area
Average Home Value in this Area
Purchase History
| Date | Buyer | Sale Price | Title Company |
|---|---|---|---|
| Eppes Jonathan D | $165,000 | Southwest Abstract & Title C | |
| Davis Darcy E | $150,000 | -- | |
| -- | $125,000 | -- |
Source: Public Records
Mortgage History
| Date | Status | Borrower | Loan Amount |
|---|---|---|---|
| Open | Eppes Jonathan D | $168,500 | |
| Previous Owner | Davis Darcy E | $154,846 |
Source: Public Records
Tax History
| Year | Tax Paid | Tax Assessment Tax Assessment Total Assessment is a certain percentage of the fair market value that is determined by local assessors to be the total taxable value of land and additions on the property. | Land | Improvement |
|---|---|---|---|---|
| 2025 | $1,568 | $14,745 | $2,131 | $12,614 |
| 2024 | $1,558 | $14,445 | $2,131 | $12,314 |
| 2023 | $1,558 | $14,445 | $2,131 | $12,314 |
| 2022 | $1,625 | $14,445 | $2,131 | $12,314 |
| 2021 | $1,361 | $14,612 | $2,131 | $12,481 |
| 2020 | $1,703 | $16,794 | $2,131 | $14,663 |
| 2019 | $1,713 | $16,794 | $2,131 | $14,663 |
| 2018 | $1,805 | $17,498 | $2,131 | $15,367 |
| 2017 | $1,763 | $17,658 | $2,131 | $15,527 |
| 2016 | $1,819 | $18,532 | $2,131 | $16,401 |
| 2015 | $1,815 | $18,532 | $2,131 | $16,401 |
| 2014 | $1,791 | $18,532 | $2,131 | $16,401 |
Source: Public Records
Map
Nearby Homes
- 207 & 1/2 N Crater Creek Rd
- 209 E B Ave
- 433 NE Creekside Dr
- 817 Hummingbird Dr
- 206 W C Ave
- 207 C Ave
- 205 NW Cherry Ave
- 214 NW Sandstone Ave
- 405 N Mountain Meadow Dr
- 207 Pine Ave
- 205 Pine Ave
- 206 Pine Ave
- 112 NW Elm Ave
- 108 NW Elm Ave
- 111 S 6th St
- 703 SW 6th
- 104 NW Elm Ave
- 815 W D Ave
- 17168 W Gore Blvd
- 168 SW Crater Creek Rd
- 101 Deacons Row
- 105 Deacons Row
- 202 N Crater Creek Rd
- 107 Deacons Row
- 93 NW Crater Creek Rd
- 203 N Crater Creek Rd
- 1134 NW Airport Rd
- 705 NW Crater Creek Rd
- 205 N Crater Creek Rd
- 201 N Crater Creek Rd
- 117 N Crater Creek Rd
- 207 1/2 N Crater Creek Rd
- 207 N Crater Creek Rd
- 118 Crater Creek Rd
- 111 N Crater Creek Rd
- 1 Tibbs Dr
- 118 N Crater Creek Rd
- 113 N Crater Creek Rd
- 116 N Crater Creek Rd
- 202 Rowells Ln
Your Personal Tour Guide
Ask me questions while you tour the home.