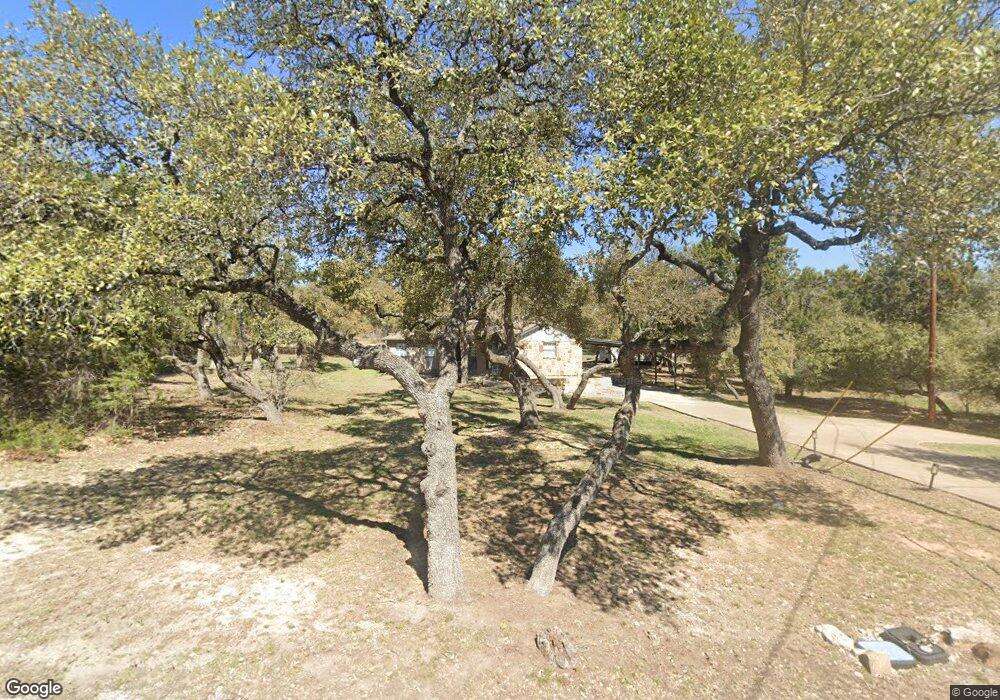
103 Deer Creek Cir Dripping Springs, TX 78620
Hamilton Pool NeighborhoodEstimated Value: $478,000 - $603,000
3
Beds
2
Baths
1,443
Sq Ft
$374/Sq Ft
Est. Value
About This Home
This home is located at 103 Deer Creek Cir, Dripping Springs, TX 78620 and is currently estimated at $539,488, approximately $373 per square foot. 103 Deer Creek Cir is a home located in Hays County with nearby schools including Dripping Springs Middle School and Dripping Springs High School.
Ownership History
Date
Name
Owned For
Owner Type
Purchase Details
Closed on
Oct 26, 2022
Sold by
Rushing Darrien K
Bought by
J & H Rr12 Holdings Llc
Current Estimated Value
Purchase Details
Closed on
Oct 4, 2021
Sold by
Bevil Starreffidle Robert Lee and Satterfield Kristie L
Bought by
Rushing Darrien K
Home Financials for this Owner
Home Financials are based on the most recent Mortgage that was taken out on this home.
Original Mortgage
$477,000
Interest Rate
2.8%
Mortgage Type
New Conventional
Purchase Details
Closed on
Sep 30, 2011
Sold by
Stafford Terry Lee and Stafford Susan
Bought by
Satterfield Robert Lee Bevil and Satterfield Kristie L
Home Financials for this Owner
Home Financials are based on the most recent Mortgage that was taken out on this home.
Original Mortgage
$132,520
Interest Rate
4.24%
Mortgage Type
New Conventional
Create a Home Valuation Report for This Property
The Home Valuation Report is an in-depth analysis detailing your home's value as well as a comparison with similar homes in the area
Home Values in the Area
Average Home Value in this Area
Purchase History
| Date | Buyer | Sale Price | Title Company |
|---|---|---|---|
| J & H Rr12 Holdings Llc | -- | Independence Title | |
| J & H Rr12 Holdings Llc | -- | Independence Title | |
| Rushing Darrien K | -- | Independence Title | |
| Satterfield Robert Lee Bevil | -- | None Available |
Source: Public Records
Mortgage History
| Date | Status | Borrower | Loan Amount |
|---|---|---|---|
| Previous Owner | Rushing Darrien K | $477,000 | |
| Previous Owner | Satterfield Robert Lee Bevil | $132,520 |
Source: Public Records
Tax History Compared to Growth
Tax History
| Year | Tax Paid | Tax Assessment Tax Assessment Total Assessment is a certain percentage of the fair market value that is determined by local assessors to be the total taxable value of land and additions on the property. | Land | Improvement |
|---|---|---|---|---|
| 2025 | $7,209 | $442,836 | $256,810 | $186,026 |
| 2024 | $7,209 | $460,903 | $256,810 | $204,093 |
| 2023 | $8,778 | $581,340 | $256,810 | $324,530 |
| 2022 | $7,331 | $429,840 | $92,520 | $337,320 |
| 2021 | $5,501 | $294,010 | $68,210 | $225,800 |
| 2020 | $4,834 | $277,340 | $54,480 | $222,860 |
| 2019 | $5,339 | $258,920 | $42,450 | $216,470 |
| 2018 | $4,914 | $236,984 | $42,450 | $204,770 |
| 2017 | $4,502 | $215,440 | $32,610 | $182,830 |
| 2016 | $4,278 | $204,720 | $32,610 | $172,110 |
| 2015 | $3,580 | $195,940 | $32,610 | $163,330 |
Source: Public Records
Map
Nearby Homes
- 621 Deer Creek Cir
- 31887 Mirela Ann Ln
- 101 Twin Creek Rd
- Lot A (Subdivided) Mirela Ann Rd
- Lot D (Subdivided) Mirela Ann Rd
- Lot G (Subdivided) Mirela Ann Rd
- 0 Westward Look
- 17621 Panorama Dr
- 10978 W Cave Blvd
- 17503 Panorama Dr
- 17517 Panorama Dr
- 17811 Mason Dixon Cir
- 10806 Glenview Cir
- 17837 Panorama Dr
- 10624 Lake Park Dr
- 17912 Turkey Trot Trail
- 10511 Lake Park Dr
- 10722 Lake Park Dr
- 10802 & 10804 Timber Cir
- 10627 Lake Park Dr
- Deer lCreek Ranch Lo Deer Creek Ranch Lot 5b
- 000 Deer Creek Cir
- LOT 12A Deer Creek Ranch
- 105 Deer Creek Cir
- 24471 Ranch Road 12
- 24471 Rr 12
- 104 Deer Creek Cir
- 108 Deer Creek Cir
- 205 Deer Creek Cir
- 203 Deer Creek Cir
- 261 Deer Creek Cir
- 32080 Ranch Road 12
- 32080 Ranch Road 12
- 32308 Ranch Road 12
- 395 Deer Creek Cir
- 32310 Ranch Road 12
- 200 Deer Creek Cir
- 204 Deer Creek Cir
- 1201 Deer Creek Cir
- 206 Deer Creek Cir