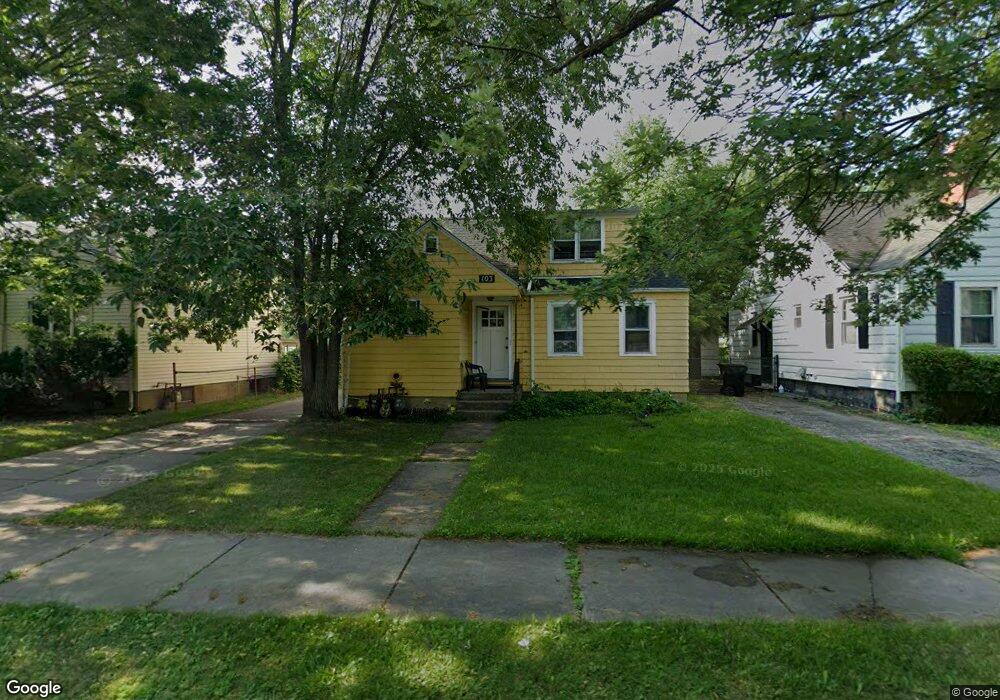
103 Delton St Tonawanda, NY 14150
Estimated Value: $154,000 - $312,000
5
Beds
3
Baths
1,930
Sq Ft
$130/Sq Ft
Est. Value
About This Home
This home is located at 103 Delton St, Tonawanda, NY 14150 and is currently estimated at $251,074, approximately $130 per square foot. 103 Delton St is a home located in Erie County with nearby schools including Mullen Elementary School, Tonawanda Elementary School, and Tonawanda Middle High School.
Ownership History
Date
Name
Owned For
Owner Type
Purchase Details
Closed on
May 28, 2009
Sold by
Aranda Stephen G and Aranda Victoria E
Bought by
Hardick Albert and Hardick Gina
Current Estimated Value
Purchase Details
Closed on
Jan 18, 2008
Sold by
Genesis Rei Llc and Aranda Steve
Bought by
Aranda Steve and Aranda Victoria
Purchase Details
Closed on
Jul 31, 2006
Sold by
Genesis Rei Llc
Bought by
Aranda Stephen G and Aranda Victoria E
Purchase Details
Closed on
Dec 15, 2005
Sold by
Pilgrim Properties Llc
Bought by
Genesis Rei Llc
Purchase Details
Closed on
Feb 4, 2005
Sold by
Cornerstone Associates Inc
Bought by
Pilgrim Properties Llc and Genesis Rei Llc
Create a Home Valuation Report for This Property
The Home Valuation Report is an in-depth analysis detailing your home's value as well as a comparison with similar homes in the area
Home Values in the Area
Average Home Value in this Area
Purchase History
| Date | Buyer | Sale Price | Title Company |
|---|---|---|---|
| Hardick Albert | $37,500 | None Available | |
| Aranda Steve | -- | None Available | |
| Aranda Stephen G | $94,900 | None Available | |
| Genesis Rei Llc | -- | None Available | |
| Pilgrim Properties Llc | -- | -- |
Source: Public Records
Tax History Compared to Growth
Tax History
| Year | Tax Paid | Tax Assessment Tax Assessment Total Assessment is a certain percentage of the fair market value that is determined by local assessors to be the total taxable value of land and additions on the property. | Land | Improvement |
|---|---|---|---|---|
| 2024 | $3,249 | $215,000 | $18,500 | $196,500 |
| 2023 | $3,109 | $215,000 | $18,500 | $196,500 |
| 2022 | $2,713 | $122,000 | $11,700 | $110,300 |
| 2021 | $2,703 | $122,000 | $11,700 | $110,300 |
| 2020 | $2,672 | $122,000 | $11,700 | $110,300 |
| 2019 | $4,040 | $122,000 | $11,700 | $110,300 |
| 2018 | $2,603 | $122,000 | $11,700 | $110,300 |
| 2017 | $599 | $99,000 | $9,600 | $89,400 |
| 2016 | $2,330 | $99,000 | $9,600 | $89,400 |
| 2015 | -- | $99,000 | $9,600 | $89,400 |
| 2014 | -- | $99,000 | $9,600 | $89,400 |
Source: Public Records
Map
Nearby Homes