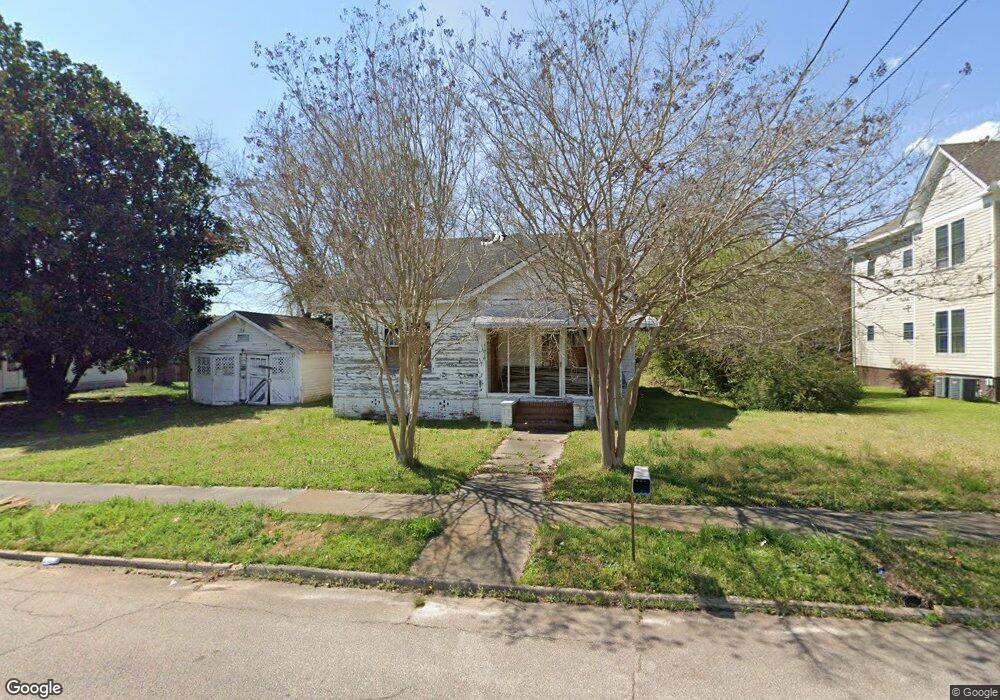
103 Dixie St Unit 55 Lagrange, GA 30241
Estimated Value: $48,000 - $115,000
3
Beds
2
Baths
1,641
Sq Ft
$49/Sq Ft
Est. Value
About This Home
This home is located at 103 Dixie St Unit 55, Lagrange, GA 30241 and is currently estimated at $80,693, approximately $49 per square foot. 103 Dixie St Unit 55 is a home located in Troup County with nearby schools including Hollis Hand Elementary School, Franklin Forest Elementary School, and Ethel W. Kight Elementary School.
Ownership History
Date
Name
Owned For
Owner Type
Purchase Details
Closed on
Nov 1, 2019
Sold by
Lopez Hector Solis
Bought by
Wint Mario
Current Estimated Value
Purchase Details
Closed on
Jan 25, 2019
Sold by
Freeman Sherida Lynn
Bought by
Lopez Hector Solis
Purchase Details
Closed on
Dec 14, 2018
Sold by
Secretary Of Veterans Affairs
Bought by
Freeman Sherida Lynn
Purchase Details
Closed on
Sep 4, 2018
Sold by
Regions Bank
Bought by
Secretary Of Veterans Affairs
Purchase Details
Closed on
Apr 28, 1994
Sold by
Billy G Banks
Bought by
Fann James Ross and Fann Alice D
Purchase Details
Closed on
Mar 18, 1991
Sold by
Doris M Bowles
Bought by
Billy G Banks
Purchase Details
Closed on
Mar 8, 1991
Sold by
Qc
Bought by
Doris M Bowles
Purchase Details
Closed on
Mar 1, 1991
Sold by
Qc
Bought by
Qc
Purchase Details
Closed on
May 20, 1980
Sold by
J T and Bowles Doris M
Bought by
Qc
Purchase Details
Closed on
Oct 1, 1961
Sold by
Pate Williams
Bought by
J T and Bowles Doris M
Create a Home Valuation Report for This Property
The Home Valuation Report is an in-depth analysis detailing your home's value as well as a comparison with similar homes in the area
Purchase History
| Date | Buyer | Sale Price | Title Company |
|---|---|---|---|
| Wint Mario | $23,000 | -- | |
| Lopez Hector Solis | $20,000 | -- | |
| Freeman Sherida Lynn | $12,300 | -- | |
| Secretary Of Veterans Affairs | -- | -- | |
| Regions Bank | $18,820 | -- | |
| Fann James Ross | $36,500 | -- | |
| Billy G Banks | $18,500 | -- | |
| Doris M Bowles | -- | -- | |
| Qc | -- | -- | |
| Qc | -- | -- | |
| J T | -- | -- |
Source: Public Records
Tax History
| Year | Tax Paid | Tax Assessment Tax Assessment Total Assessment is a certain percentage of the fair market value that is determined by local assessors to be the total taxable value of land and additions on the property. | Land | Improvement |
|---|---|---|---|---|
| 2025 | $444 | $16,280 | $2,840 | $13,440 |
| 2024 | $384 | $14,080 | $2,840 | $11,240 |
| 2023 | $332 | $12,160 | $2,840 | $9,320 |
| 2022 | $325 | $11,640 | $2,840 | $8,800 |
| 2021 | $345 | $11,440 | $2,840 | $8,600 |
| 2020 | $350 | $11,600 | $2,840 | $8,760 |
| 2019 | $148 | $25,320 | $2,880 | $22,440 |
| 2018 | $704 | $25,320 | $2,880 | $22,440 |
| 2017 | $704 | $25,320 | $2,880 | $22,440 |
| 2016 | $681 | $24,574 | $2,880 | $21,694 |
| 2015 | $683 | $24,574 | $2,880 | $21,694 |
| 2014 | $649 | $23,432 | $2,880 | $20,552 |
| 2013 | -- | $24,814 | $2,880 | $21,934 |
Source: Public Records
Map
Nearby Homes
- 103 Dixie St
- 105 Dixie St
- 621 Greenville St
- 624 Arthur St
- 619 Greenville St
- 701 Greenville St
- 617 Greenville St
- 619 Arthur St
- 615 Greenville St
- 617 Arthur St
- 201 Dixie St
- 622 Chattahoochee St
- 618 Arthur St
- 620 Chattahoochee St
- 613 Greenville St
- 615 Arthur St
- 618 Chattahoochee St
- 616 Arthur St
- 621 Chattahoochee St
- 611 Greenville St
Your Personal Tour Guide
Ask me questions while you tour the home.