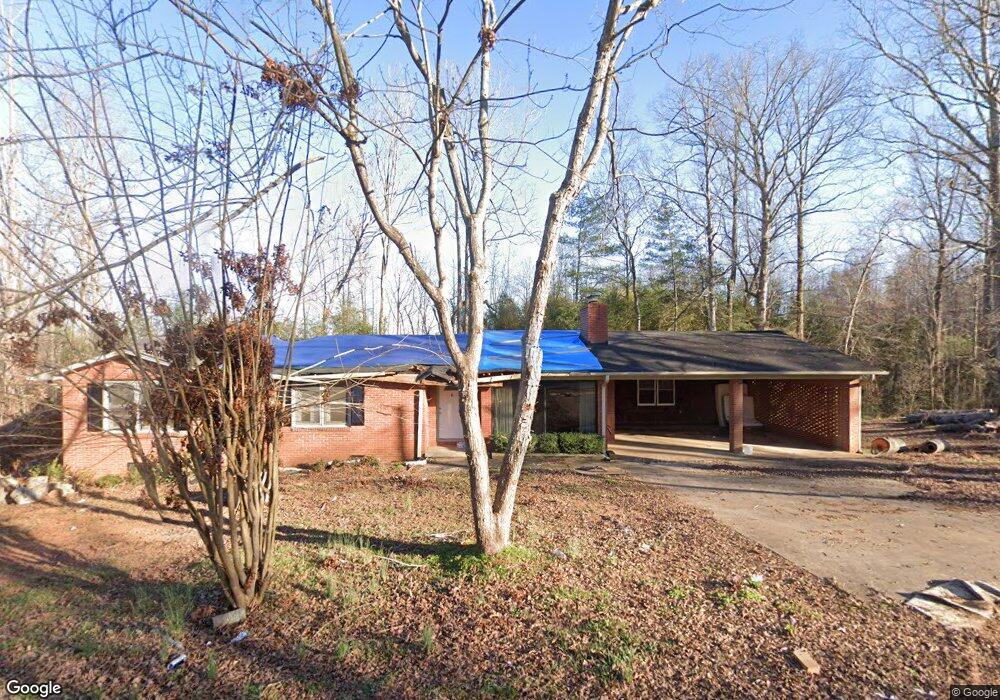
103 Duncan Dr Mooresboro, NC 28114
Estimated Value: $158,000 - $222,000
--
Bed
--
Bath
1,660
Sq Ft
$110/Sq Ft
Est. Value
About This Home
This home is located at 103 Duncan Dr, Mooresboro, NC 28114 and is currently estimated at $183,098, approximately $110 per square foot. 103 Duncan Dr is a home located in Cleveland County with nearby schools including Springmore Elementary School, Crest Middle School, and Crest High School.
Create a Home Valuation Report for This Property
The Home Valuation Report is an in-depth analysis detailing your home's value as well as a comparison with similar homes in the area
Home Values in the Area
Average Home Value in this Area
Tax History Compared to Growth
Tax History
| Year | Tax Paid | Tax Assessment Tax Assessment Total Assessment is a certain percentage of the fair market value that is determined by local assessors to be the total taxable value of land and additions on the property. | Land | Improvement |
|---|---|---|---|---|
| 2025 | $828 | $174,973 | $12,375 | $162,598 |
| 2024 | $828 | $94,086 | $9,375 | $84,711 |
| 2023 | $824 | $94,086 | $9,375 | $84,711 |
| 2022 | $824 | $94,086 | $9,375 | $84,711 |
| 2021 | $413 | $94,086 | $9,375 | $84,711 |
| 2020 | $346 | $73,931 | $9,375 | $64,556 |
| 2019 | $346 | $73,931 | $9,375 | $64,556 |
| 2018 | $344 | $73,931 | $9,375 | $64,556 |
| 2017 | $342 | $73,931 | $9,375 | $64,556 |
| 2016 | $326 | $73,931 | $9,375 | $64,556 |
| 2015 | $400 | $92,578 | $7,500 | $85,078 |
| 2014 | $400 | $92,578 | $7,500 | $85,078 |
Source: Public Records
Map
Nearby Homes
- 100 Duncan Dr
- 106 Burrus Rd
- 113 N Academy St
- 114 Shady Ln
- 4710 Ellenboro Rd
- 416 W Main St
- 450 Lemmons Rd Unit 4
- 112 Gene McGaha Ln
- 00 Lattimore Rd
- 109 Nc 120 Hwy
- 000 Campfield Church Rd
- 0 Westlee St
- 123 Blue Sky Cir
- 144 Brown Ln
- 156 Brown Ln
- 309 E Main St
- 125 Faye Toney Rd
- 000 New House Rd
- 128 Westlee St Unit B
- 128 Westlee St Unit C