Estimated Value: $291,000 - $659,000
4
Beds
4
Baths
2,380
Sq Ft
$175/Sq Ft
Est. Value
About This Home
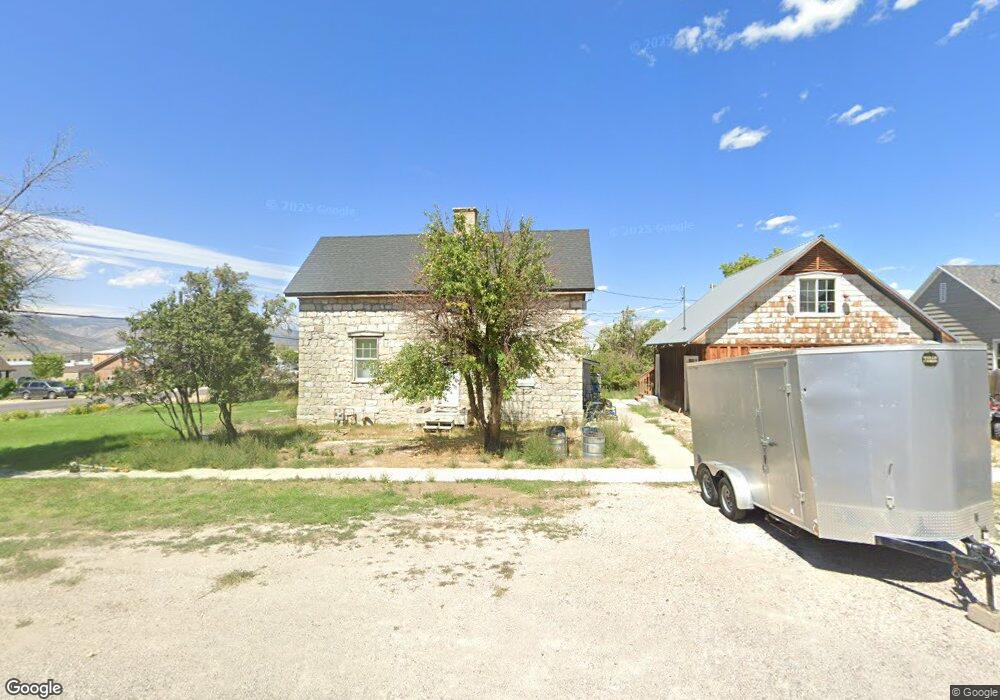
This home is located at 103 E 100 S, Manti, UT 84642 and is currently estimated at $416,311, approximately $174 per square foot. 103 E 100 S is a home located in Sanpete County.
Ownership History
Date
Name
Owned For
Owner Type
Purchase Details
Closed on
Nov 16, 2016
Sold by
Wilcox Joel D and Wilcox Richael W
Bought by
Heath Michael
Current Estimated Value
Home Financials for this Owner
Home Financials are based on the most recent Mortgage that was taken out on this home.
Original Mortgage
$139,600
Outstanding Balance
$111,349
Interest Rate
3.47%
Mortgage Type
New Conventional
Estimated Equity
$304,962
Purchase Details
Closed on
Oct 1, 2009
Sold by
Basso Herbert K and Basso Wendy
Bought by
Wilcox Joel D and Wilcox Rachel W
Purchase Details
Closed on
Jan 28, 2005
Sold by
Cofer Dean
Bought by
Cofer Serena J
Create a Home Valuation Report for This Property
The Home Valuation Report is an in-depth analysis detailing your home's value as well as a comparison with similar homes in the area
Home Values in the Area
Average Home Value in this Area
Purchase History
| Date | Buyer | Sale Price | Title Company |
|---|---|---|---|
| Heath Michael | -- | D Land Title-Manti | |
| Wilcox Joel D | -- | -- | |
| Cofer Serena J | -- | -- |
Source: Public Records
Mortgage History
| Date | Status | Borrower | Loan Amount |
|---|---|---|---|
| Open | Heath Michael | $139,600 |
Source: Public Records
Tax History
| Year | Tax Paid | Tax Assessment Tax Assessment Total Assessment is a certain percentage of the fair market value that is determined by local assessors to be the total taxable value of land and additions on the property. | Land | Improvement |
|---|---|---|---|---|
| 2025 | $2,113 | $213,273 | $0 | $0 |
| 2024 | $2,093 | $201,168 | $0 | $0 |
| 2023 | $2,084 | $188,890 | $0 | $0 |
| 2022 | $1,809 | $149,492 | $0 | $0 |
| 2021 | $1,727 | $123,565 | $0 | $0 |
| 2020 | $1,618 | $108,851 | $0 | $0 |
| 2019 | $1,536 | $101,544 | $0 | $0 |
| 2018 | $1,382 | $88,299 | $26,730 | $61,569 |
| 2017 | $1,237 | $83,215 | $0 | $0 |
| 2016 | $1,161 | $78,095 | $0 | $0 |
| 2015 | $1,166 | $78,095 | $0 | $0 |
| 2014 | $1,143 | $78,095 | $0 | $0 |
| 2013 | $1,129 | $77,637 | $0 | $0 |
Source: Public Records
Map
Nearby Homes
Your Personal Tour Guide
Ask me questions while you tour the home.