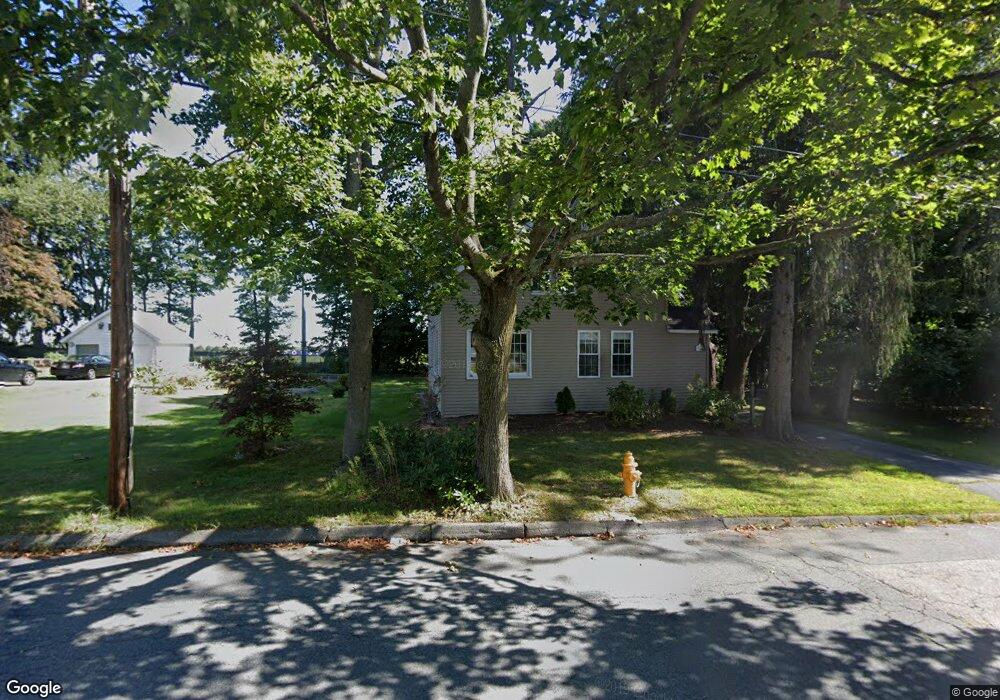
103 Epworth St Worcester, MA 01610
College Hill NeighborhoodEstimated Value: $378,000 - $434,000
3
Beds
2
Baths
1,452
Sq Ft
$275/Sq Ft
Est. Value
About This Home
This home is located at 103 Epworth St, Worcester, MA 01610 and is currently estimated at $399,937, approximately $275 per square foot. 103 Epworth St is a home located in Worcester County with nearby schools including Quinsigamond School, Jacob Hiatt Magnet School, and Chandler Magnet.
Ownership History
Date
Name
Owned For
Owner Type
Purchase Details
Closed on
Apr 15, 2015
Sold by
Woollacott Vanessa
Bought by
College Of Holy Cross
Current Estimated Value
Purchase Details
Closed on
Mar 18, 2009
Sold by
Vanessa Woollacott Ret
Bought by
Magnuson Vanessa W
Home Financials for this Owner
Home Financials are based on the most recent Mortgage that was taken out on this home.
Original Mortgage
$222,791
Interest Rate
5.25%
Mortgage Type
FHA
Purchase Details
Closed on
Jan 2, 2002
Sold by
Borglund Christopher I and Alicandro Virginia I
Bought by
Woollacott Vanessa
Home Financials for this Owner
Home Financials are based on the most recent Mortgage that was taken out on this home.
Original Mortgage
$135,375
Interest Rate
6.72%
Mortgage Type
Purchase Money Mortgage
Create a Home Valuation Report for This Property
The Home Valuation Report is an in-depth analysis detailing your home's value as well as a comparison with similar homes in the area
Home Values in the Area
Average Home Value in this Area
Purchase History
| Date | Buyer | Sale Price | Title Company |
|---|---|---|---|
| College Of Holy Cross | $209,000 | -- | |
| Magnuson Vanessa W | -- | -- | |
| Woollacott Vanessa | $142,500 | -- |
Source: Public Records
Mortgage History
| Date | Status | Borrower | Loan Amount |
|---|---|---|---|
| Previous Owner | Magnuson Vanessa W | $222,791 | |
| Previous Owner | Woollacott Vanessa | $22,400 | |
| Previous Owner | Woollacott Vanessa | $136,800 | |
| Previous Owner | Woollacott Vanessa | $135,375 |
Source: Public Records
Tax History Compared to Growth
Tax History
| Year | Tax Paid | Tax Assessment Tax Assessment Total Assessment is a certain percentage of the fair market value that is determined by local assessors to be the total taxable value of land and additions on the property. | Land | Improvement |
|---|---|---|---|---|
| 2025 | $4,820 | $365,400 | $118,300 | $247,100 |
| 2024 | $4,630 | $336,700 | $118,300 | $218,400 |
| 2023 | $4,440 | $309,600 | $102,900 | $206,700 |
| 2022 | $4,079 | $268,200 | $82,300 | $185,900 |
| 2021 | $3,945 | $242,300 | $65,900 | $176,400 |
| 2020 | $3,767 | $221,600 | $65,900 | $155,700 |
| 2019 | $3,622 | $201,200 | $59,300 | $141,900 |
| 2018 | $0 | $191,300 | $59,300 | $132,000 |
| 2017 | $0 | $180,600 | $59,300 | $121,300 |
| 2016 | -- | $165,600 | $43,300 | $122,300 |
| 2015 | -- | $165,600 | $43,300 | $122,300 |
| 2014 | $3,236 | $165,600 | $43,300 | $122,300 |
Source: Public Records
Map
Nearby Homes