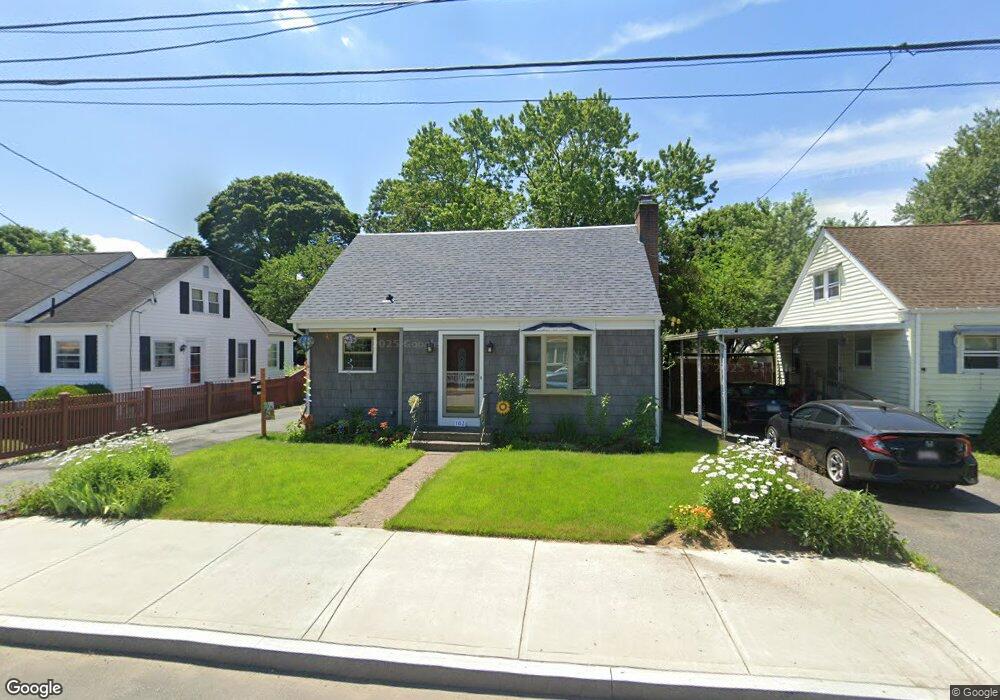
103 Flint St Pawtucket, RI 02861
Darlington NeighborhoodEstimated Value: $399,000 - $431,774
3
Beds
1
Bath
1,559
Sq Ft
$267/Sq Ft
Est. Value
About This Home
This home is located at 103 Flint St, Pawtucket, RI 02861 and is currently estimated at $415,944, approximately $266 per square foot. 103 Flint St is a home located in Providence County with nearby schools including St Cecilia School and Dayspring Christian Academy.
Ownership History
Date
Name
Owned For
Owner Type
Purchase Details
Closed on
Jun 9, 2004
Sold by
Sheehan Paul
Bought by
Bradshaw John
Current Estimated Value
Home Financials for this Owner
Home Financials are based on the most recent Mortgage that was taken out on this home.
Original Mortgage
$178,400
Outstanding Balance
$85,880
Interest Rate
5.99%
Estimated Equity
$330,064
Purchase Details
Closed on
Jun 4, 1996
Sold by
Thrift Colin P and Thrift Christina
Bought by
Sheehan Paul V and Sheehan Christine
Create a Home Valuation Report for This Property
The Home Valuation Report is an in-depth analysis detailing your home's value as well as a comparison with similar homes in the area
Home Values in the Area
Average Home Value in this Area
Purchase History
| Date | Buyer | Sale Price | Title Company |
|---|---|---|---|
| Bradshaw John | $233,000 | -- | |
| Bradshaw John M | $230,000 | -- | |
| Sheehan Paul V | $107,000 | -- |
Source: Public Records
Mortgage History
| Date | Status | Borrower | Loan Amount |
|---|---|---|---|
| Open | Sheehan Paul V | $178,400 | |
| Closed | Sheehan Paul V | $178,400 | |
| Closed | Sheehan Paul V | $33,450 |
Source: Public Records
Tax History
| Year | Tax Paid | Tax Assessment Tax Assessment Total Assessment is a certain percentage of the fair market value that is determined by local assessors to be the total taxable value of land and additions on the property. | Land | Improvement |
|---|---|---|---|---|
| 2025 | $4,767 | $362,500 | $156,100 | $206,400 |
| 2024 | $4,473 | $362,500 | $156,100 | $206,400 |
| 2023 | $3,659 | $216,000 | $71,400 | $144,600 |
| 2022 | $3,581 | $216,000 | $71,400 | $144,600 |
| 2021 | $3,581 | $216,000 | $71,400 | $144,600 |
| 2020 | $3,629 | $173,700 | $64,600 | $109,100 |
| 2019 | $3,629 | $173,700 | $64,600 | $109,100 |
| 2018 | $3,497 | $173,700 | $64,600 | $109,100 |
| 2017 | $3,322 | $146,200 | $50,400 | $95,800 |
| 2016 | $3,200 | $146,200 | $50,400 | $95,800 |
| 2015 | $3,200 | $146,200 | $50,400 | $95,800 |
| 2014 | $3,134 | $135,900 | $50,400 | $85,500 |
Source: Public Records
Map
Nearby Homes
- 207 Benefit St
- 386 Mendon Ave
- 179 Columbine Ave
- 215 Kenyon Ave
- 40 Linton St
- 37 Turner St
- 61 Mendon Rd
- 67 Norton St
- 50 Pullman Ave Unit A
- 50 Pullman Ave Unit B
- 79 Turner St
- 548 Kenyon Ave Unit 25
- 548 Kenyon Ave Unit 4
- 39 Chaplin St
- 0 Chaplin St
- 460 Collins St Unit 6
- 460 Collins St Unit 9
- 83 Chaplin St
- 58 Baltic St Unit 58
- 56 Baltic St Unit 56
Your Personal Tour Guide
Ask me questions while you tour the home.