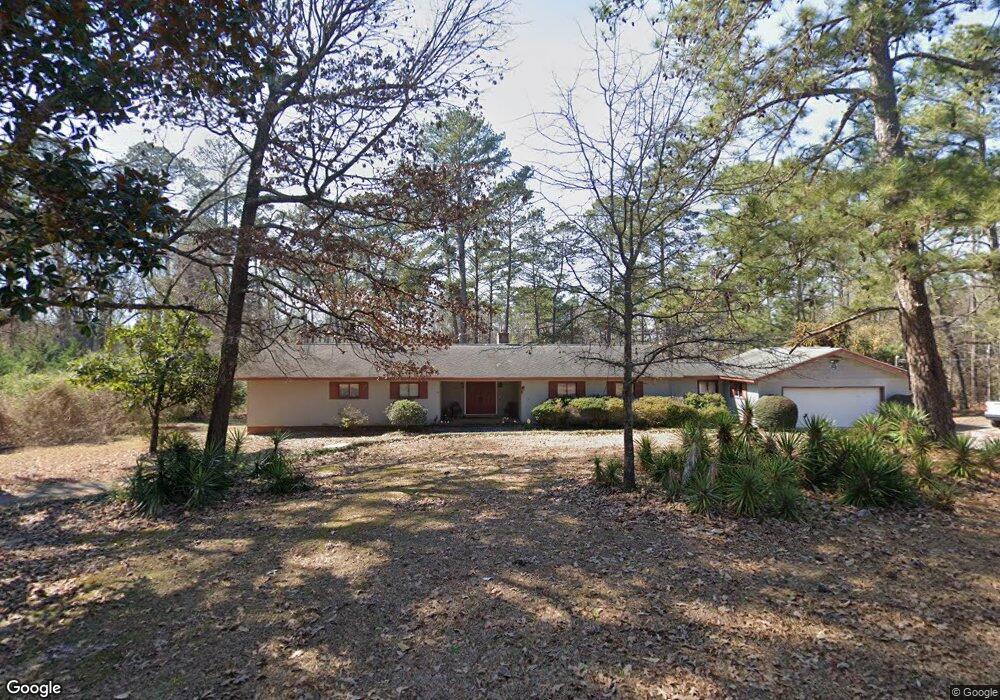
103 Frog Holler Dr Warner Robins, GA 31093
Estimated Value: $279,586 - $377,000
--
Bed
--
Bath
2,268
Sq Ft
$138/Sq Ft
Est. Value
About This Home
This home is located at 103 Frog Holler Dr, Warner Robins, GA 31093 and is currently estimated at $312,647, approximately $137 per square foot. 103 Frog Holler Dr is a home located in Houston County with nearby schools including Northside Elementary School, Northside Middle School, and Northside High School.
Ownership History
Date
Name
Owned For
Owner Type
Purchase Details
Closed on
Jan 29, 2024
Sold by
Bertram Barbara H
Bought by
Bertram Clinton Kyle
Current Estimated Value
Purchase Details
Closed on
Mar 25, 2009
Sold by
Bertram George O
Bought by
Bertram Barbara H
Purchase Details
Closed on
Feb 6, 1973
Sold by
Roman Michael A and Roman Eva E
Bought by
Bertram George O and Bertram Barbara H
Purchase Details
Closed on
Aug 31, 1971
Sold by
Burke Kathleen Mary
Bought by
Roman Michael A and Roman Eva E
Purchase Details
Closed on
Aug 25, 1971
Sold by
Burke Patrick Declan
Bought by
Burke Kathleen Mary
Purchase Details
Closed on
Mar 26, 1971
Sold by
Greer Kenneth E
Bought by
Burke Patrick Declan
Purchase Details
Closed on
Apr 18, 1968
Sold by
Greer Kenneth E
Bought by
Greer Kenneth E
Purchase Details
Closed on
Nov 28, 1967
Sold by
Kirkland G Van B
Bought by
Greer Kenneth E
Create a Home Valuation Report for This Property
The Home Valuation Report is an in-depth analysis detailing your home's value as well as a comparison with similar homes in the area
Home Values in the Area
Average Home Value in this Area
Purchase History
| Date | Buyer | Sale Price | Title Company |
|---|---|---|---|
| Bertram Clinton Kyle | $150,000 | None Listed On Document | |
| Bertram Barbara H | -- | -- | |
| Bertram George O | -- | -- | |
| Roman Michael A | -- | -- | |
| Burke Kathleen Mary | -- | -- | |
| Burke Patrick Declan | -- | -- | |
| Greer Kenneth E | -- | -- | |
| Greer Kenneth E | -- | -- |
Source: Public Records
Tax History Compared to Growth
Tax History
| Year | Tax Paid | Tax Assessment Tax Assessment Total Assessment is a certain percentage of the fair market value that is determined by local assessors to be the total taxable value of land and additions on the property. | Land | Improvement |
|---|---|---|---|---|
| 2024 | $2,310 | $96,560 | $19,880 | $76,680 |
| 2023 | $1,949 | $80,640 | $19,880 | $60,760 |
| 2022 | $1,779 | $73,600 | $18,200 | $55,400 |
| 2021 | $1,556 | $64,040 | $18,200 | $45,840 |
| 2020 | $1,552 | $63,600 | $18,200 | $45,400 |
| 2019 | $1,552 | $63,600 | $18,200 | $45,400 |
| 2018 | $1,552 | $63,600 | $18,200 | $45,400 |
| 2017 | $1,554 | $63,600 | $18,200 | $45,400 |
| 2016 | $1,556 | $63,600 | $18,200 | $45,400 |
| 2015 | $1,559 | $63,600 | $18,200 | $45,400 |
| 2014 | -- | $63,600 | $18,200 | $45,400 |
| 2013 | -- | $64,040 | $18,200 | $45,840 |
Source: Public Records
Map
Nearby Homes
- 403 Fieldstone Rd
- 102 Heritage Dr
- 107 Stonefield Ct
- 136 Scarborough Rd
- 106 Maple Glen Ct
- 111 Red Oak Glen
- 213 Dogwood Glen
- 103 Persimmon Glen Ct
- 102 Montiego Ct
- 102 Pine Glen Ct
- 106 Tor Dr
- 918 Collins Ave Unit 36
- 94 Tiffany Ln
- 211 Custer Dr
- 224 Crestwood Cir
- 60 Tiffany Ln
- 101 Kent Dr
- 152 Rock Run Trail
- 131 Martin Mill Trail
- 101 Frog Holler Dr
- 102 Frog Holler Dr
- 104 Frog Holler Dr
- 106 Frog Holler Dr
- 915 Dunbar Rd
- 0 Dunbar Dr Unit 132074
- 924 Dunbar Rd
- 945 Dunbar Rd
- 940 Dunbar Rd
- 922 Dunbar Rd
- 918 Dunbar Rd
- 106 Horseshoe Dr
- 914 Dunbar Rd
- 111 Fairfield Ct
- 109 Fairfield Ct
- 910 Dunbar Rd
- 113 Fairfield Ct
- 907 Dunbar Rd
- 108 Horseshoe Dr
- 106 General Lee Rd