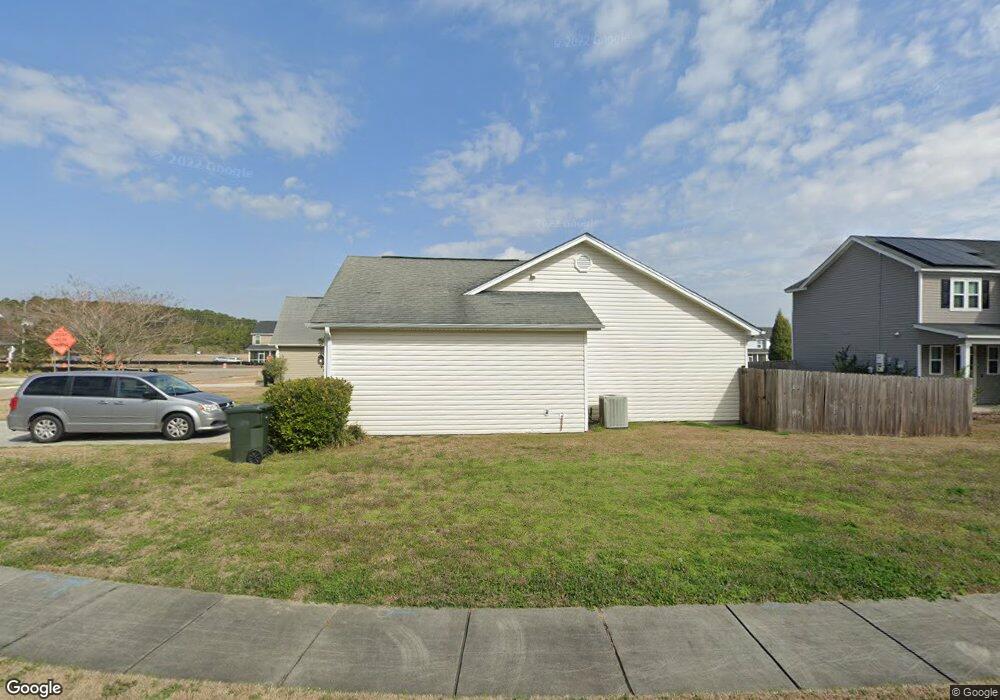
103 Gavins Way Goose Creek, SC 29445
Estimated Value: $296,930 - $329,000
3
Beds
2
Baths
1,305
Sq Ft
$239/Sq Ft
Est. Value
About This Home
This home is located at 103 Gavins Way, Goose Creek, SC 29445 and is currently estimated at $312,483, approximately $239 per square foot. 103 Gavins Way is a home located in Berkeley County with nearby schools including Boulder Bluff Elementary School, Sedgefield Middle School, and Goose Creek High School.
Ownership History
Date
Name
Owned For
Owner Type
Purchase Details
Closed on
Dec 13, 2019
Sold by
Scioto Properties Sp 16 Llc
Bought by
Sbf2019 1 Properties Llc
Current Estimated Value
Home Financials for this Owner
Home Financials are based on the most recent Mortgage that was taken out on this home.
Original Mortgage
$44,746,000
Outstanding Balance
$20,994,809
Interest Rate
3.6%
Mortgage Type
Commercial
Estimated Equity
-$20,682,326
Purchase Details
Closed on
May 7, 2013
Sold by
Scioto Properties Sp-15 Llc
Bought by
Scioto Properties Sp-16 Llc
Purchase Details
Closed on
Mar 30, 2011
Sold by
Saluda Properties Llc
Bought by
Scioto Properties Sp 15 Llc
Purchase Details
Closed on
Apr 19, 2007
Sold by
Sk Builders Inc
Bought by
Saluda Properties Llc
Home Financials for this Owner
Home Financials are based on the most recent Mortgage that was taken out on this home.
Original Mortgage
$150,210
Interest Rate
6.1%
Mortgage Type
Purchase Money Mortgage
Create a Home Valuation Report for This Property
The Home Valuation Report is an in-depth analysis detailing your home's value as well as a comparison with similar homes in the area
Home Values in the Area
Average Home Value in this Area
Purchase History
| Date | Buyer | Sale Price | Title Company |
|---|---|---|---|
| Sbf2019 1 Properties Llc | -- | Os National Llc | |
| Scioto Properties Sp-16 Llc | $166,900 | -- | |
| Scioto Properties Sp 15 Llc | -- | -- | |
| Saluda Properties Llc | $166,900 | None Available |
Source: Public Records
Mortgage History
| Date | Status | Borrower | Loan Amount |
|---|---|---|---|
| Open | Sbf2019 1 Properties Llc | $44,746,000 | |
| Previous Owner | Saluda Properties Llc | $150,210 |
Source: Public Records
Tax History Compared to Growth
Tax History
| Year | Tax Paid | Tax Assessment Tax Assessment Total Assessment is a certain percentage of the fair market value that is determined by local assessors to be the total taxable value of land and additions on the property. | Land | Improvement |
|---|---|---|---|---|
| 2025 | $3,511 | $201,595 | $47,374 | $154,221 |
| 2024 | $3,511 | $12,095 | $2,842 | $9,253 |
| 2023 | $3,511 | $12,095 | $2,842 | $9,253 |
| 2022 | $3,323 | $10,518 | $2,700 | $7,818 |
| 2021 | $3,409 | $10,520 | $2,700 | $7,818 |
| 2020 | $3,335 | $10,518 | $2,700 | $7,818 |
| 2019 | $2,679 | $10,518 | $2,700 | $7,818 |
| 2018 | $2,476 | $7,314 | $2,100 | $5,214 |
| 2017 | $2,470 | $7,314 | $2,100 | $5,214 |
| 2016 | $2,469 | $7,310 | $2,100 | $5,210 |
| 2015 | $2,370 | $7,310 | $2,100 | $5,210 |
| 2014 | $2,182 | $7,310 | $2,100 | $5,210 |
| 2013 | -- | $7,310 | $2,100 | $5,210 |
Source: Public Records
Map
Nearby Homes
- 282 Swallowtail Ln
- 116 Kirkland St
- Lot 23 Dennis Dr
- Lot 24 Dennis Dr
- Bristol Plan at The Landings at Montague
- Franklin Plan at The Landings at Montague
- Chatham Plan at The Landings at Montague
- 417 Robin Dr
- 529 Amy Dr
- 123 Kirkland St
- 121 Kirkland St
- 125 Kirkland St
- 450 Duskywing Dr
- 127 Kirkland St
- 448 Duskywing Dr
- 446 Duskywing Dr
- 444 Duskywing Dr
- 409 Robin Dr
- 442 Duskywing Dr
- 438 Duskywing Dr