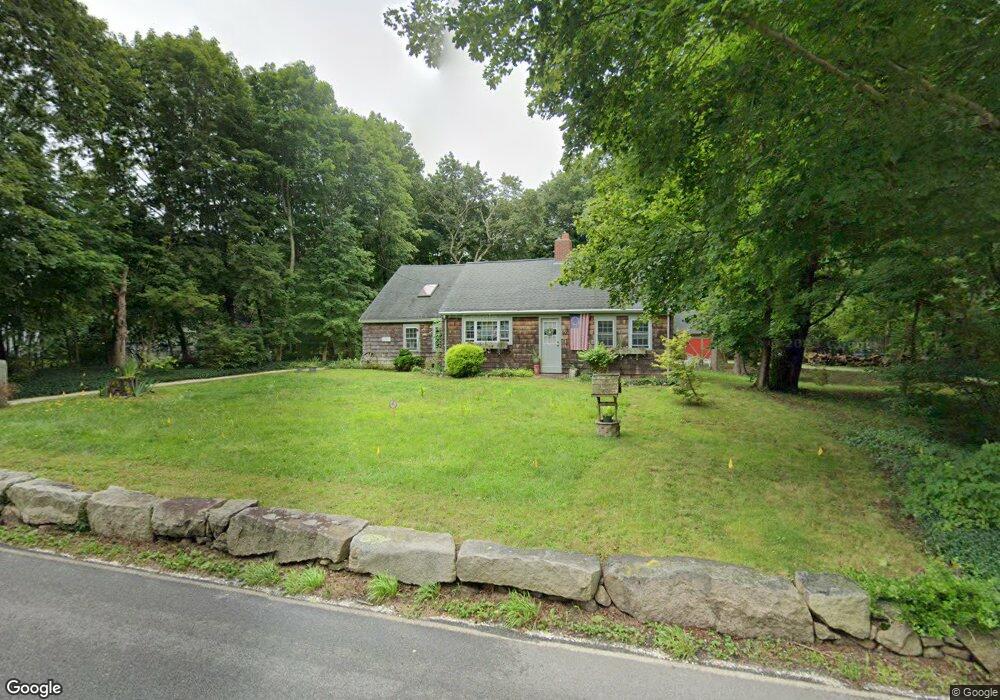
103 Gifford Rd Westport, MA 02790
North Westport NeighborhoodEstimated Value: $410,000 - $648,000
3
Beds
--
Bath
2,070
Sq Ft
$253/Sq Ft
Est. Value
About This Home
This home is located at 103 Gifford Rd, Westport, MA 02790 and is currently estimated at $524,171, approximately $253 per square foot. 103 Gifford Rd is a home located in Bristol County with nearby schools including Alice A. Macomber Primary School, Westport Elementary School, and Westport Middle-High School.
Ownership History
Date
Name
Owned For
Owner Type
Purchase Details
Closed on
Nov 13, 2000
Sold by
Tongue Dorothy and Tongue Joseph Rosemary
Bought by
Fortier Derren
Current Estimated Value
Purchase Details
Closed on
May 11, 2000
Sold by
Tongue Dorothy P and Joseph Rosemary
Bought by
Borden Thomas E and Borden Timothy E
Create a Home Valuation Report for This Property
The Home Valuation Report is an in-depth analysis detailing your home's value as well as a comparison with similar homes in the area
Home Values in the Area
Average Home Value in this Area
Purchase History
| Date | Buyer | Sale Price | Title Company |
|---|---|---|---|
| Fortier Derren | $115,000 | -- | |
| Borden Thomas E | $80,000 | -- |
Source: Public Records
Mortgage History
| Date | Status | Borrower | Loan Amount |
|---|---|---|---|
| Open | Borden Thomas E | $161,700 | |
| Closed | Borden Thomas E | $26,000 |
Source: Public Records
Tax History Compared to Growth
Tax History
| Year | Tax Paid | Tax Assessment Tax Assessment Total Assessment is a certain percentage of the fair market value that is determined by local assessors to be the total taxable value of land and additions on the property. | Land | Improvement |
|---|---|---|---|---|
| 2025 | $2,468 | $331,300 | $187,000 | $144,300 |
| 2024 | $2,392 | $309,400 | $166,000 | $143,400 |
| 2023 | $2,305 | $282,500 | $151,300 | $131,200 |
| 2022 | $2,343 | $276,300 | $151,300 | $125,000 |
| 2021 | $0 | $250,000 | $125,000 | $125,000 |
| 2020 | $2,065 | $245,000 | $120,000 | $125,000 |
| 2019 | $2,039 | $246,600 | $120,000 | $126,600 |
| 2018 | $3,264 | $216,300 | $117,700 | $98,600 |
| 2017 | $1,708 | $214,300 | $113,900 | $100,400 |
| 2016 | $1,666 | $210,600 | $110,200 | $100,400 |
| 2015 | $1,670 | $210,600 | $112,700 | $97,900 |
Source: Public Records
Map
Nearby Homes