103 Glen St Betterton, MD 21610
Estimated Value: $229,000 - $290,013
3
Beds
2
Baths
1,788
Sq Ft
$151/Sq Ft
Est. Value
About This Home
This home is located at 103 Glen St, Betterton, MD 21610 and is currently estimated at $269,753, approximately $150 per square foot. 103 Glen St is a home located in Kent County with nearby schools including Kent County Middle School and Kent County High School.
Ownership History
Date
Name
Owned For
Owner Type
Purchase Details
Closed on
Oct 31, 2007
Sold by
Mcaleese Patrick P
Bought by
Cronin David M
Current Estimated Value
Home Financials for this Owner
Home Financials are based on the most recent Mortgage that was taken out on this home.
Original Mortgage
$190,000
Outstanding Balance
$120,401
Interest Rate
6.41%
Mortgage Type
Purchase Money Mortgage
Estimated Equity
$149,352
Purchase Details
Closed on
Oct 30, 2007
Sold by
Mcaleese Patrick P
Bought by
Cronin David M
Home Financials for this Owner
Home Financials are based on the most recent Mortgage that was taken out on this home.
Original Mortgage
$190,000
Outstanding Balance
$120,401
Interest Rate
6.41%
Mortgage Type
Purchase Money Mortgage
Estimated Equity
$149,352
Purchase Details
Closed on
Apr 22, 2005
Sold by
Dimaggio Anthony J
Bought by
Mcaleese Patrick P
Purchase Details
Closed on
Mar 24, 1997
Sold by
Dimaggio Anthony J and Dimaggio Mary K
Bought by
Dimaggio Anthony J
Create a Home Valuation Report for This Property
The Home Valuation Report is an in-depth analysis detailing your home's value as well as a comparison with similar homes in the area
Purchase History
| Date | Buyer | Sale Price | Title Company |
|---|---|---|---|
| Cronin David M | $200,000 | -- | |
| Cronin David M | $200,000 | -- | |
| Mcaleese Patrick P | -- | -- | |
| Dimaggio Anthony J | -- | -- |
Source: Public Records
Mortgage History
| Date | Status | Borrower | Loan Amount |
|---|---|---|---|
| Open | Cronin David M | $190,000 | |
| Closed | Cronin David M | $190,000 |
Source: Public Records
Tax History
| Year | Tax Paid | Tax Assessment Tax Assessment Total Assessment is a certain percentage of the fair market value that is determined by local assessors to be the total taxable value of land and additions on the property. | Land | Improvement |
|---|---|---|---|---|
| 2025 | $3,264 | $224,800 | $96,300 | $128,500 |
| 2024 | $2,981 | $205,300 | $0 | $0 |
| 2023 | $2,698 | $185,800 | $0 | $0 |
| 2022 | $2,398 | $166,300 | $96,300 | $70,000 |
| 2021 | $2,415 | $166,300 | $96,300 | $70,000 |
| 2020 | $2,415 | $166,300 | $96,300 | $70,000 |
| 2019 | $2,527 | $174,000 | $105,300 | $68,700 |
| 2018 | $2,527 | $174,000 | $105,300 | $68,700 |
| 2017 | $2,530 | $174,000 | $0 | $0 |
| 2016 | -- | $180,800 | $0 | $0 |
| 2015 | $2,630 | $180,800 | $0 | $0 |
| 2014 | $2,630 | $180,800 | $0 | $0 |
Source: Public Records
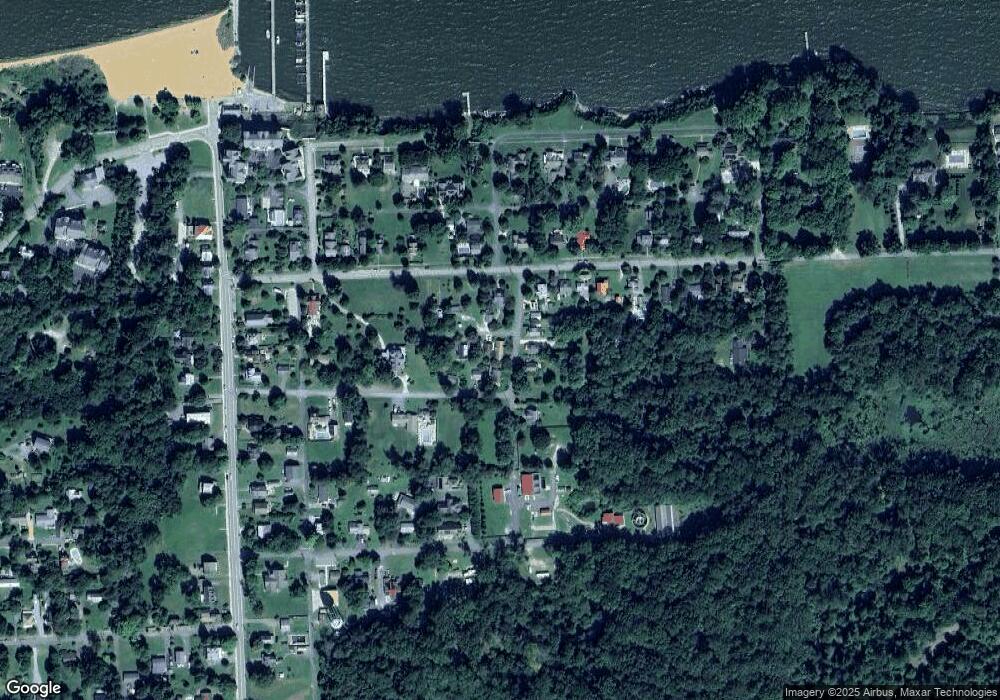
Map
Nearby Homes
- 0 1st Ave
- 10 Ericsson Ave Unit 37
- 1 Idlewhile Ave Unit 4
- 201 Ericsson Ave
- 0 Dutchtown Rd
- 0 Blackmon Ln
- 302 Cecil Ave
- 24 Ches Haven Rd
- 0 Ohio Ave
- 16 Ches Haven Rd
- 25619 W Hill Rd
- 26670 Maple Ave
- 0 Main St
- 26663 Maple Ave
- 0 Medders Rd
- 12733 Still Pond Rd
- 25209 Wymont Park Rd
- 12400 Woods Rd
- 0 Still Pond Creek Rd Unit MDKE2005888
- 12118 Still Pond Creek Rd
Your Personal Tour Guide
Ask me questions while you tour the home.