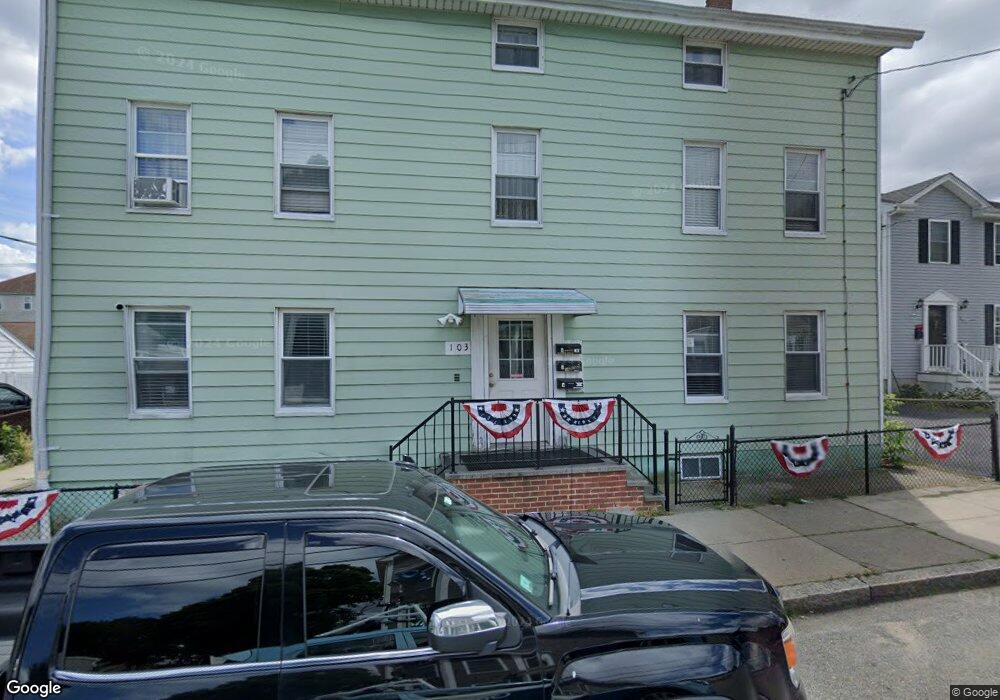
103 Grinnell St Fall River, MA 02721
Niagara NeighborhoodEstimated Value: $577,000 - $614,000
7
Beds
3
Baths
2,785
Sq Ft
$214/Sq Ft
Est. Value
About This Home
This home is located at 103 Grinnell St, Fall River, MA 02721 and is currently estimated at $595,500, approximately $213 per square foot. 103 Grinnell St is a home located in Bristol County with nearby schools including William S Greene, Talbot Innovation School, and B M C Durfee High School.
Create a Home Valuation Report for This Property
The Home Valuation Report is an in-depth analysis detailing your home's value as well as a comparison with similar homes in the area
Home Values in the Area
Average Home Value in this Area
Tax History
| Year | Tax Paid | Tax Assessment Tax Assessment Total Assessment is a certain percentage of the fair market value that is determined by local assessors to be the total taxable value of land and additions on the property. | Land | Improvement |
|---|---|---|---|---|
| 2025 | $4,372 | $381,800 | $72,200 | $309,600 |
| 2024 | $4,182 | $364,000 | $69,600 | $294,400 |
| 2023 | $3,639 | $296,600 | $57,500 | $239,100 |
| 2022 | $3,034 | $255,200 | $54,700 | $200,500 |
| 2021 | $3,034 | $219,400 | $52,100 | $167,300 |
| 2020 | $2,714 | $187,800 | $51,300 | $136,500 |
| 2019 | $2,298 | $157,600 | $49,400 | $108,200 |
| 2018 | $2,262 | $154,700 | $53,500 | $101,200 |
| 2017 | $2,131 | $152,200 | $51,000 | $101,200 |
| 2016 | $2,084 | $152,900 | $54,300 | $98,600 |
| 2015 | $2,000 | $152,900 | $54,300 | $98,600 |
| 2014 | $2,365 | $188,000 | $79,800 | $108,200 |
Source: Public Records
Map
Nearby Homes
Your Personal Tour Guide
Ask me questions while you tour the home.