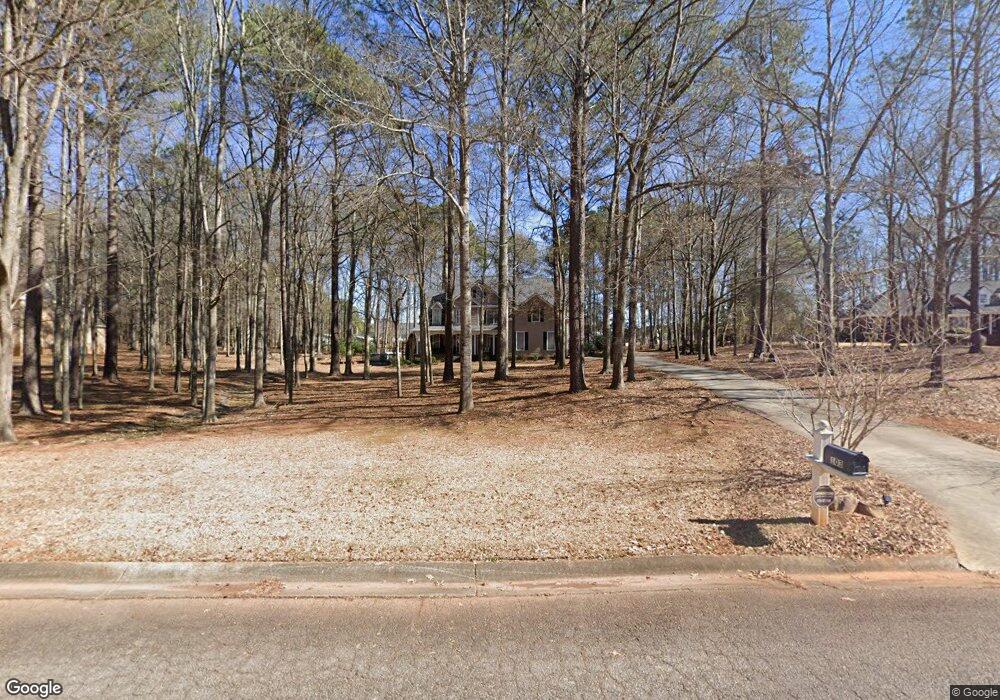
103 Hamilton Ct Griffin, GA 30224
Estimated Value: $479,996 - $640,000
5
Beds
3
Baths
2,889
Sq Ft
$184/Sq Ft
Est. Value
About This Home
This home is located at 103 Hamilton Ct, Griffin, GA 30224 and is currently estimated at $532,499, approximately $184 per square foot. 103 Hamilton Ct is a home located in Pike County with nearby schools including Pike County Primary School, Pike County Elementary School, and Pike County Middle School.
Ownership History
Date
Name
Owned For
Owner Type
Purchase Details
Closed on
Apr 13, 2017
Sold by
Manion Brian J
Bought by
Manion Brian J and Lagioia Dee N
Current Estimated Value
Home Financials for this Owner
Home Financials are based on the most recent Mortgage that was taken out on this home.
Original Mortgage
$288,800
Outstanding Balance
$238,639
Interest Rate
4.3%
Mortgage Type
New Conventional
Estimated Equity
$293,860
Purchase Details
Closed on
Feb 18, 2004
Sold by
Hull Chris and Hull Tiffany
Bought by
Bunn Faye J
Purchase Details
Closed on
Apr 3, 2000
Sold by
Reid James and Reid Stacy
Bought by
Hull Chris and Hull Tiffany
Purchase Details
Closed on
Jul 27, 1999
Sold by
Smith Danny and Smith Nina
Bought by
Reid James and Reid Stacy
Purchase Details
Closed on
May 25, 1999
Sold by
Hutchinson Farms Llc
Bought by
Smith Danny and Smith Nina
Purchase Details
Closed on
May 9, 1996
Bought by
Hutchinson Farms Llc
Create a Home Valuation Report for This Property
The Home Valuation Report is an in-depth analysis detailing your home's value as well as a comparison with similar homes in the area
Purchase History
| Date | Buyer | Sale Price | Title Company |
|---|---|---|---|
| Manion Brian J | $304,000 | -- | |
| Manion Brian J | $304,000 | -- | |
| Bunn Faye J | $255,000 | -- | |
| Hull Chris | $37,000 | -- | |
| Reid James | $30,500 | -- | |
| Smith Danny | $27,500 | -- | |
| Hutchinson Farms Llc | -- | -- |
Source: Public Records
Mortgage History
| Date | Status | Borrower | Loan Amount |
|---|---|---|---|
| Open | Manion Brian J | $288,800 | |
| Closed | Manion Brian J | $288,800 |
Source: Public Records
Tax History
| Year | Tax Paid | Tax Assessment Tax Assessment Total Assessment is a certain percentage of the fair market value that is determined by local assessors to be the total taxable value of land and additions on the property. | Land | Improvement |
|---|---|---|---|---|
| 2025 | $4,520 | $190,519 | $12,045 | $178,474 |
| 2024 | $4,275 | $174,394 | $12,045 | $162,349 |
| 2023 | $5,005 | $174,394 | $12,045 | $162,349 |
| 2022 | $3,548 | $124,186 | $12,045 | $112,141 |
| 2021 | $3,672 | $124,186 | $12,045 | $112,141 |
| 2020 | $3,715 | $124,186 | $12,045 | $112,141 |
| 2019 | $3,623 | $106,841 | $19,296 | $87,545 |
| 2018 | $3,626 | $106,841 | $19,296 | $87,545 |
| 2017 | $2,917 | $106,841 | $19,296 | $87,545 |
| 2016 | $2,720 | $106,841 | $19,296 | $87,545 |
| 2015 | $2,597 | $106,841 | $19,296 | $87,545 |
| 2014 | $2,629 | $106,841 | $19,296 | $87,545 |
| 2013 | -- | $106,840 | $19,296 | $87,544 |
Source: Public Records
Map
Nearby Homes
- 551 Carter Rd
- 17 Brookwood Way
- 211 Lake Chase Dr N
- 234 Lake Chase Dr N
- 14375 U S 19
- 580 I B Howard Rd
- 105 Garnet Ln
- 118 Rockbridge Loop
- 105 Ruby Way
- 100 Cambridge Dr S
- 122 Bramble Way
- 131 Bramble Way
- 76 Abbey Ct
- 43 Wellington Dr
- 143 Buck Trail
- 103 Huntington Terrace
- 221 Hidden Falls Walk
- 120 Huntington Terrace
- 15040 U S Highway 19
- 15040 Highway 19
- 129 Hamilton Ct
- 51 Hamilton Ct Unit 23
- 51 Hamilton Ct
- 23 Hamilton Ct
- 82 Hamilton Ct
- 515 Carter Rd
- 130 Hamilton Ct
- 141 Hamilton Ct
- 138 Hamilton Ct
- 122 Harrington Walk
- 282 Harrington Walk
- 100 Brookwood Way
- 291 Carter Rd
- 88 Harrington Walk
- 386 Harrington Walk
- 320 Harrington Walk
- 239 Harrington Walk
- 145 Harrington Walk
- 0 Brookwood Way Unit LOT 35 20024032
- 0 Brookwood Way Unit 33 7610427
Your Personal Tour Guide
Ask me questions while you tour the home.