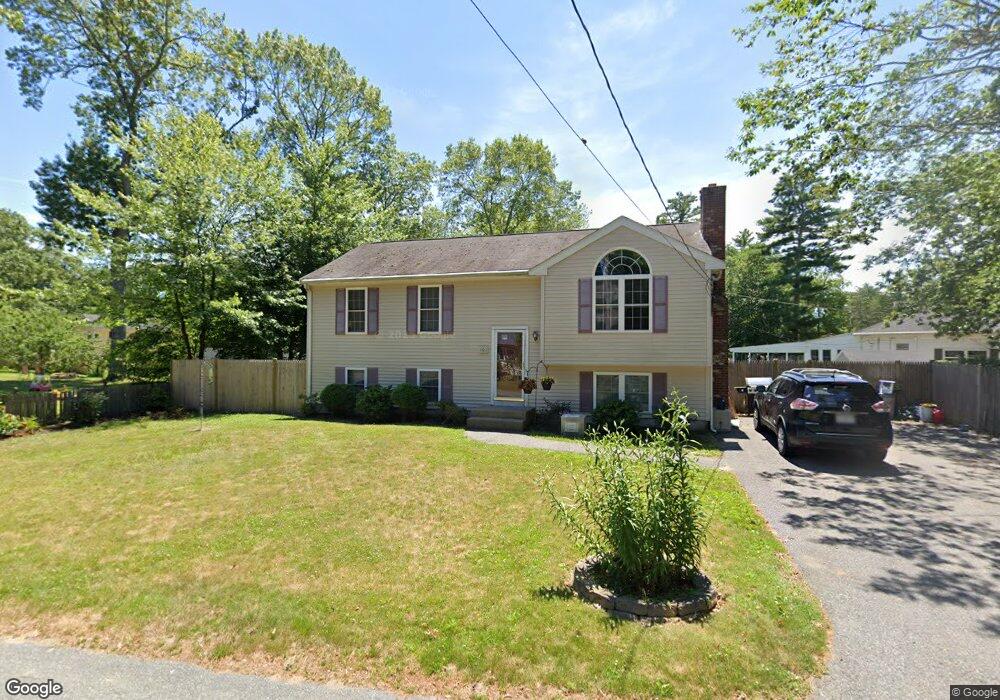
103 Hancock St Monponsett, MA 02350
Estimated Value: $440,500 - $482,000
3
Beds
1
Bath
974
Sq Ft
$469/Sq Ft
Est. Value
About This Home
This home is located at 103 Hancock St, Monponsett, MA 02350 and is currently estimated at $456,875, approximately $469 per square foot. 103 Hancock St is a home located in Plymouth County.
Ownership History
Date
Name
Owned For
Owner Type
Purchase Details
Closed on
Oct 1, 2008
Sold by
Perkins Colman and Connor Karen E
Bought by
Perkins Coleman and Perkins Karen E
Current Estimated Value
Home Financials for this Owner
Home Financials are based on the most recent Mortgage that was taken out on this home.
Original Mortgage
$180,000
Outstanding Balance
$120,326
Interest Rate
6.54%
Estimated Equity
$336,549
Purchase Details
Closed on
Apr 10, 2000
Sold by
Elko Constr Corp
Bought by
Perkins Colman and Connor Karen E
Home Financials for this Owner
Home Financials are based on the most recent Mortgage that was taken out on this home.
Original Mortgage
$124,900
Interest Rate
8.3%
Mortgage Type
Purchase Money Mortgage
Create a Home Valuation Report for This Property
The Home Valuation Report is an in-depth analysis detailing your home's value as well as a comparison with similar homes in the area
Home Values in the Area
Average Home Value in this Area
Purchase History
| Date | Buyer | Sale Price | Title Company |
|---|---|---|---|
| Perkins Coleman | -- | -- | |
| Perkins Colman | $165,900 | -- |
Source: Public Records
Mortgage History
| Date | Status | Borrower | Loan Amount |
|---|---|---|---|
| Open | Perkins Colman | $180,000 | |
| Previous Owner | Perkins Colman | $30,000 | |
| Previous Owner | Perkins Colman | $124,900 |
Source: Public Records
Tax History Compared to Growth
Tax History
| Year | Tax Paid | Tax Assessment Tax Assessment Total Assessment is a certain percentage of the fair market value that is determined by local assessors to be the total taxable value of land and additions on the property. | Land | Improvement |
|---|---|---|---|---|
| 2025 | $4,680 | $349,800 | $142,100 | $207,700 |
| 2024 | $4,545 | $339,700 | $138,000 | $201,700 |
| 2023 | $4,479 | $315,900 | $138,000 | $177,900 |
| 2022 | $4,366 | $289,300 | $125,400 | $163,900 |
| 2021 | $3,958 | $262,100 | $120,600 | $141,500 |
| 2020 | $3,894 | $255,000 | $116,500 | $138,500 |
| 2019 | $3,645 | $234,700 | $107,100 | $127,600 |
| 2018 | $3,597 | $227,200 | $103,000 | $124,200 |
| 2017 | $3,378 | $211,400 | $91,600 | $119,800 |
| 2016 | $3,436 | $207,600 | $91,600 | $116,000 |
| 2015 | $3,257 | $204,600 | $91,600 | $113,000 |
Source: Public Records
Map
Nearby Homes