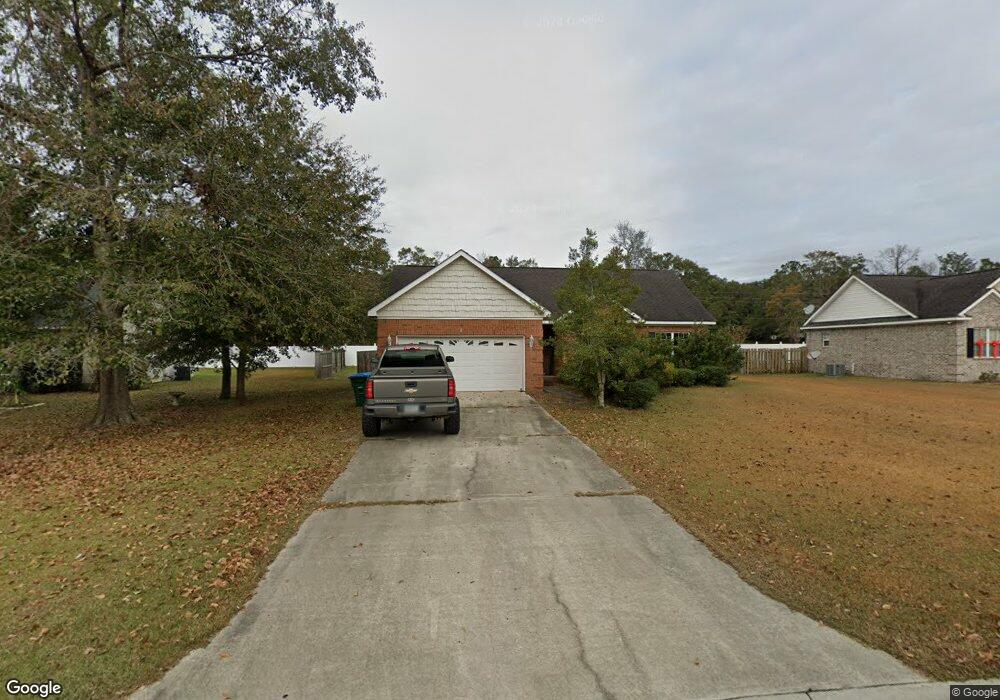
103 Harvest Dr Springfield, GA 31329
Estimated Value: $268,422 - $296,000
3
Beds
2
Baths
1,491
Sq Ft
$187/Sq Ft
Est. Value
About This Home
This home is located at 103 Harvest Dr, Springfield, GA 31329 and is currently estimated at $278,856, approximately $187 per square foot. 103 Harvest Dr is a home located in Effingham County with nearby schools including Springfield Elementary School, Effingham County Middle School, and Effingham County High School.
Ownership History
Date
Name
Owned For
Owner Type
Purchase Details
Closed on
Oct 14, 2016
Sold by
Barnes Braydon C and Barnes Amy
Bought by
Brabham Dell R
Current Estimated Value
Home Financials for this Owner
Home Financials are based on the most recent Mortgage that was taken out on this home.
Original Mortgage
$121,125
Outstanding Balance
$96,706
Interest Rate
3.5%
Mortgage Type
New Conventional
Estimated Equity
$182,150
Purchase Details
Closed on
Mar 23, 2015
Sold by
Barnes Braydon C
Bought by
Barnes Braydon C and Barnes Amy
Home Financials for this Owner
Home Financials are based on the most recent Mortgage that was taken out on this home.
Original Mortgage
$122,346
Interest Rate
3.87%
Mortgage Type
New Conventional
Purchase Details
Closed on
Oct 7, 2014
Sold by
Cruz Jose J
Bought by
Amber Way Llc
Purchase Details
Closed on
Feb 16, 2006
Sold by
Cruz Jose J
Bought by
Cruz Jose J and Cruz Margaret A
Create a Home Valuation Report for This Property
The Home Valuation Report is an in-depth analysis detailing your home's value as well as a comparison with similar homes in the area
Home Values in the Area
Average Home Value in this Area
Purchase History
| Date | Buyer | Sale Price | Title Company |
|---|---|---|---|
| Brabham Dell R | $127,500 | -- | |
| Barnes Braydon C | -- | -- | |
| Barnes Braydon C | $119,900 | -- | |
| Amber Way Llc | $110,000 | -- | |
| Cruz Jose J | -- | -- |
Source: Public Records
Mortgage History
| Date | Status | Borrower | Loan Amount |
|---|---|---|---|
| Open | Brabham Dell R | $121,125 | |
| Previous Owner | Barnes Braydon C | $122,346 |
Source: Public Records
Tax History Compared to Growth
Tax History
| Year | Tax Paid | Tax Assessment Tax Assessment Total Assessment is a certain percentage of the fair market value that is determined by local assessors to be the total taxable value of land and additions on the property. | Land | Improvement |
|---|---|---|---|---|
| 2025 | $3,698 | $101,207 | $22,800 | $78,407 |
| 2024 | $3,698 | $89,983 | $22,800 | $67,183 |
| 2023 | $2,481 | $75,124 | $17,600 | $57,524 |
| 2022 | $2,633 | $73,524 | $16,000 | $57,524 |
| 2021 | $2,306 | $63,136 | $14,000 | $49,136 |
| 2020 | $2,039 | $58,147 | $12,000 | $46,147 |
| 2019 | $1,938 | $56,147 | $10,000 | $46,147 |
| 2018 | $1,790 | $51,615 | $8,800 | $42,815 |
| 2017 | $1,802 | $51,615 | $8,800 | $42,815 |
| 2016 | $1,581 | $51,194 | $8,800 | $42,394 |
| 2015 | -- | $51,194 | $8,800 | $42,394 |
| 2014 | -- | $51,194 | $8,800 | $42,394 |
| 2013 | -- | $51,194 | $8,800 | $42,394 |
Source: Public Records
Map
Nearby Homes
- 111 Harvest Dr
- 0 Springfield Egypt Rd Unit SA343058
- 904 N Ash St
- 503 N Ash St
- 701 N Oak St
- 1173 Ga Highway 21 N
- 900 Laurel N
- 0 Georgia 119 Unit 317227
- 0 Old Tusculum Rd Unit 10578489
- 0 Old Tusculum Rd Unit SA335776
- 0 W Madison St
- 391 Hawk Hammock Dr
- 0 Zettler Rd
- 0 Hwy 21 N Unit 329376
- 0 Georgia 21 Unit C
- 0 Georgia 21 Unit B
- 0 Hwy 21 N Unit SA342214
- 132 Teal Dr
- 110 Rose Dr
- 110 Magnolia Dr