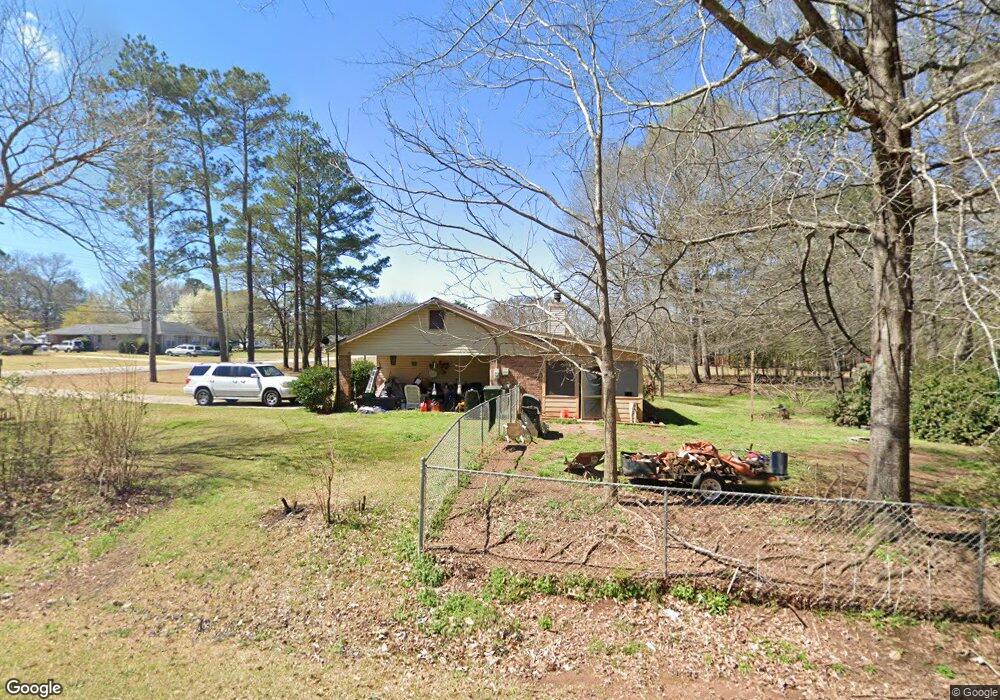
103 Hazel Way Lagrange, GA 30241
Estimated Value: $226,000 - $253,000
3
Beds
2
Baths
1,530
Sq Ft
$154/Sq Ft
Est. Value
About This Home
This home is located at 103 Hazel Way, Lagrange, GA 30241 and is currently estimated at $234,911, approximately $153 per square foot. 103 Hazel Way is a home located in Troup County with nearby schools including Callaway Elementary School, Hogansville Elementary School, and Callaway Middle School.
Ownership History
Date
Name
Owned For
Owner Type
Purchase Details
Closed on
May 28, 2010
Sold by
Dumais Eugenia Burson
Bought by
Framton Kennetha Sue
Current Estimated Value
Purchase Details
Closed on
Sep 17, 2008
Sold by
Burson Ollie Belle
Bought by
Burson Ollie Belle
Purchase Details
Closed on
Dec 1, 1982
Sold by
Ginger John C and Ginger Thompson
Bought by
Kenneth E Burson
Purchase Details
Closed on
Aug 1, 1981
Sold by
Griffin George and Griffin Joanne M
Bought by
Ginger John C and Ginger Thompson
Purchase Details
Closed on
Aug 25, 1976
Sold by
Branche Const & Averett Cont
Bought by
Griffin George and Griffin Joanne M
Purchase Details
Closed on
Aug 5, 1975
Sold by
Daniel Lumber Co
Bought by
Branche Const & Averett Cont
Purchase Details
Closed on
Aug 1, 1975
Sold by
Joe C Thomas
Bought by
Daniel Lumber Co
Purchase Details
Closed on
Jan 1, 1973
Bought by
Joe C Thomas
Create a Home Valuation Report for This Property
The Home Valuation Report is an in-depth analysis detailing your home's value as well as a comparison with similar homes in the area
Purchase History
| Date | Buyer | Sale Price | Title Company |
|---|---|---|---|
| Framton Kennetha Sue | -- | -- | |
| Burson Ollie Belle | -- | -- | |
| Kenneth E Burson | $54,600 | -- | |
| Ginger John C | -- | -- | |
| Griffin George | -- | -- | |
| Branche Const & Averett Cont | -- | -- | |
| Daniel Lumber Co | -- | -- | |
| Joe C Thomas | -- | -- |
Source: Public Records
Tax History
| Year | Tax Paid | Tax Assessment Tax Assessment Total Assessment is a certain percentage of the fair market value that is determined by local assessors to be the total taxable value of land and additions on the property. | Land | Improvement |
|---|---|---|---|---|
| 2025 | $1,706 | $75,824 | $10,000 | $65,824 |
| 2024 | $1,706 | $70,364 | $10,000 | $60,364 |
| 2023 | $1,933 | $70,860 | $10,000 | $60,860 |
| 2022 | $1,900 | $68,060 | $10,000 | $58,060 |
| 2021 | $1,661 | $55,088 | $8,000 | $47,088 |
| 2020 | $1,661 | $55,088 | $8,000 | $47,088 |
| 2019 | $1,295 | $42,944 | $4,800 | $38,144 |
| 2018 | $1,150 | $38,120 | $4,000 | $34,120 |
| 2017 | $1,150 | $38,120 | $4,000 | $34,120 |
| 2016 | $1,136 | $37,674 | $4,000 | $33,674 |
| 2015 | $1,138 | $37,674 | $4,000 | $33,674 |
| 2014 | $1,086 | $35,901 | $4,000 | $31,901 |
| 2013 | -- | $35,954 | $4,000 | $31,954 |
Source: Public Records
Map
Nearby Homes
- 106 Beaver Run
- 228 Sivell Rd
- SMOKEMONT Smokemont Dr
- 10 Whitfield Rd
- 1142 Hammett Rd
- 883 Hammett Rd
- 119 Sir Lancelot St
- 789 Hammett Rd
- 300 Old Pond Rd
- 234 River Meadow Dr
- Hemingway Plan at Crossvine Village
- Mira Plan at Crossvine Village
- Cecil Plan at Crossvine Village
- Tucker FP Plan at Crossvine Village
- Sierra Plan at Crossvine Village
- Jodeco FP Plan at Crossvine Village
- Nottely Plan at Crossvine Village
- Carter Plan at Crossvine Village
- Winston Plan at Crossvine Village
- Nelson Plan at Crossvine Village