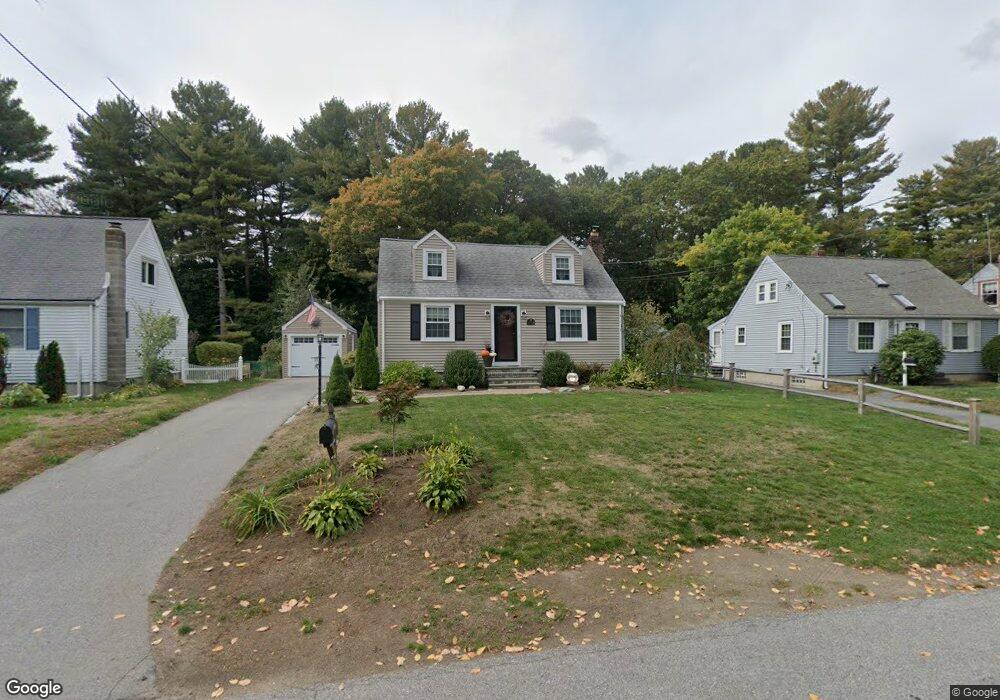
103 Higgins Rd Framingham, MA 01701
Nobscot NeighborhoodEstimated Value: $563,373 - $603,000
3
Beds
1
Bath
1,314
Sq Ft
$447/Sq Ft
Est. Value
About This Home
This home is located at 103 Higgins Rd, Framingham, MA 01701 and is currently estimated at $587,593, approximately $447 per square foot. 103 Higgins Rd is a home located in Middlesex County with nearby schools including Framingham High School, Summit Montessori School, and MetroWest Jewish Day School.
Ownership History
Date
Name
Owned For
Owner Type
Purchase Details
Closed on
Nov 5, 1993
Sold by
Kellaris Pete A and Kellaris Kennan V
Bought by
Maloney Douglas A and Maloney Deborah A
Current Estimated Value
Purchase Details
Closed on
Oct 26, 1988
Sold by
Hubbard Ralph R
Bought by
Kellaris Pete A
Create a Home Valuation Report for This Property
The Home Valuation Report is an in-depth analysis detailing your home's value as well as a comparison with similar homes in the area
Home Values in the Area
Average Home Value in this Area
Purchase History
| Date | Buyer | Sale Price | Title Company |
|---|---|---|---|
| Maloney Douglas A | $140,000 | -- | |
| Maloney Douglas A | $140,000 | -- | |
| Kellaris Pete A | $148,000 | -- |
Source: Public Records
Mortgage History
| Date | Status | Borrower | Loan Amount |
|---|---|---|---|
| Closed | Kellaris Pete A | $152,500 | |
| Closed | Kellaris Pete A | $70,000 | |
| Closed | Kellaris Pete A | $131,000 |
Source: Public Records
Tax History
| Year | Tax Paid | Tax Assessment Tax Assessment Total Assessment is a certain percentage of the fair market value that is determined by local assessors to be the total taxable value of land and additions on the property. | Land | Improvement |
|---|---|---|---|---|
| 2025 | $6,252 | $523,600 | $263,400 | $260,200 |
| 2024 | $6,123 | $491,400 | $235,200 | $256,200 |
| 2023 | $5,815 | $444,200 | $209,900 | $234,300 |
| 2022 | $5,506 | $400,700 | $190,500 | $210,200 |
| 2021 | $5,336 | $379,800 | $183,100 | $196,700 |
| 2020 | $5,394 | $360,100 | $166,400 | $193,700 |
| 2019 | $5,263 | $342,200 | $166,400 | $175,800 |
| 2018 | $5,164 | $316,400 | $160,100 | $156,300 |
| 2017 | $5,033 | $301,200 | $155,500 | $145,700 |
| 2016 | $4,842 | $278,600 | $155,500 | $123,100 |
| 2015 | $4,722 | $265,000 | $155,600 | $109,400 |
Source: Public Records
Map
Nearby Homes
- 102 Spruce St
- 51 Woodland Dr
- 484 Edgell Rd
- 63 Kellogg St
- 356 Central St
- 111 Indian Head Rd
- 32 Lyman Rd
- 2 Grove St
- 14 Ridgefield Dr
- 108 Cherry St
- 2 Chesterfield St
- 7 Ballydrain Rd
- 227 Water St
- 44 Agnes Dr
- 5 Lavelle Ln
- Lot 3 Murray Hill Rd
- 46 Cochituate Rd Unit 106
- 907 Windsor Dr
- 85 Barber Rd
- 575 Union Ave Unit 1
Your Personal Tour Guide
Ask me questions while you tour the home.