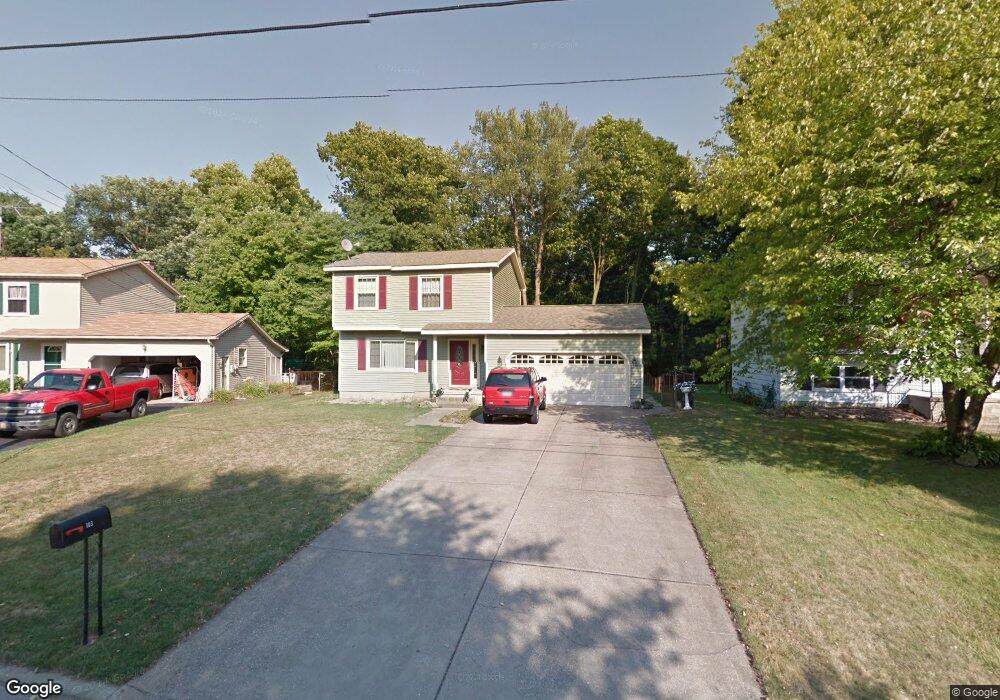
103 Hillview Dr Hubbard, OH 44425
Estimated Value: $161,000 - $194,000
3
Beds
1
Bath
1,200
Sq Ft
$143/Sq Ft
Est. Value
About This Home
This home is located at 103 Hillview Dr, Hubbard, OH 44425 and is currently estimated at $171,589, approximately $142 per square foot. 103 Hillview Dr is a home located in Trumbull County with nearby schools including Hubbard Elementary School, Hubbard Middle School, and Hubbard High School.
Ownership History
Date
Name
Owned For
Owner Type
Purchase Details
Closed on
Jan 12, 2007
Sold by
Soroka John J and Soroka Louise K
Bought by
Masluk James W and Masluk Shelly A
Current Estimated Value
Home Financials for this Owner
Home Financials are based on the most recent Mortgage that was taken out on this home.
Original Mortgage
$84,784
Outstanding Balance
$50,751
Interest Rate
6.24%
Mortgage Type
VA
Estimated Equity
$120,838
Purchase Details
Closed on
Dec 20, 2006
Sold by
Soroka John J and Soroka Louise K
Bought by
Masluk James W and Masluk Shelly A
Home Financials for this Owner
Home Financials are based on the most recent Mortgage that was taken out on this home.
Original Mortgage
$84,784
Outstanding Balance
$50,751
Interest Rate
6.24%
Mortgage Type
VA
Estimated Equity
$120,838
Purchase Details
Closed on
Jan 1, 1990
Bought by
John John J and John E
Create a Home Valuation Report for This Property
The Home Valuation Report is an in-depth analysis detailing your home's value as well as a comparison with similar homes in the area
Home Values in the Area
Average Home Value in this Area
Purchase History
| Date | Buyer | Sale Price | Title Company |
|---|---|---|---|
| Masluk James W | $83,000 | None Available | |
| Masluk James W | $83,000 | None Available | |
| John John J | -- | -- |
Source: Public Records
Mortgage History
| Date | Status | Borrower | Loan Amount |
|---|---|---|---|
| Open | Masluk James W | $84,784 | |
| Closed | Masluk James W | $84,784 |
Source: Public Records
Tax History
| Year | Tax Paid | Tax Assessment Tax Assessment Total Assessment is a certain percentage of the fair market value that is determined by local assessors to be the total taxable value of land and additions on the property. | Land | Improvement |
|---|---|---|---|---|
| 2024 | $2,340 | $47,080 | $6,720 | $40,360 |
| 2023 | $2,299 | $47,080 | $6,720 | $40,360 |
| 2022 | $1,699 | $31,720 | $6,060 | $25,660 |
| 2021 | $1,707 | $31,720 | $6,060 | $25,660 |
| 2020 | $1,714 | $31,720 | $6,060 | $25,660 |
| 2019 | $1,623 | $28,780 | $6,060 | $22,720 |
| 2018 | $1,617 | $28,780 | $6,060 | $22,720 |
| 2017 | $1,613 | $28,780 | $6,060 | $22,720 |
| 2016 | $1,489 | $28,250 | $5,990 | $22,260 |
| 2015 | $1,494 | $28,250 | $5,990 | $22,260 |
| 2014 | $1,460 | $28,250 | $5,990 | $22,260 |
| 2013 | $1,458 | $28,250 | $5,990 | $22,260 |
Source: Public Records
Map
Nearby Homes
- 868 Saul Dr
- 1145 Doris Dr
- 784 Elmwood Dr
- 2974 Schotten Rd
- 764 Jones St
- 114 Oakdale Ave
- 132 Drummond Ave
- 228 Stewart St
- 327 W Park Ave
- 1952 Hubbard Masury Rd
- 365 Scott St
- 836 School St
- 13 Oak Tree Ct
- 11 Clubhouse Dr
- 601 Wendemere Dr
- 585 Creekside Dr
- 665 Wendemere Dr
- 7058 Pine Grove Dr
- 269 Westview Ave
- 229 Jacobs Rd
Your Personal Tour Guide
Ask me questions while you tour the home.