Estimated Value: $350,537 - $544,000
3
Beds
1
Bath
1,153
Sq Ft
$407/Sq Ft
Est. Value
About This Home
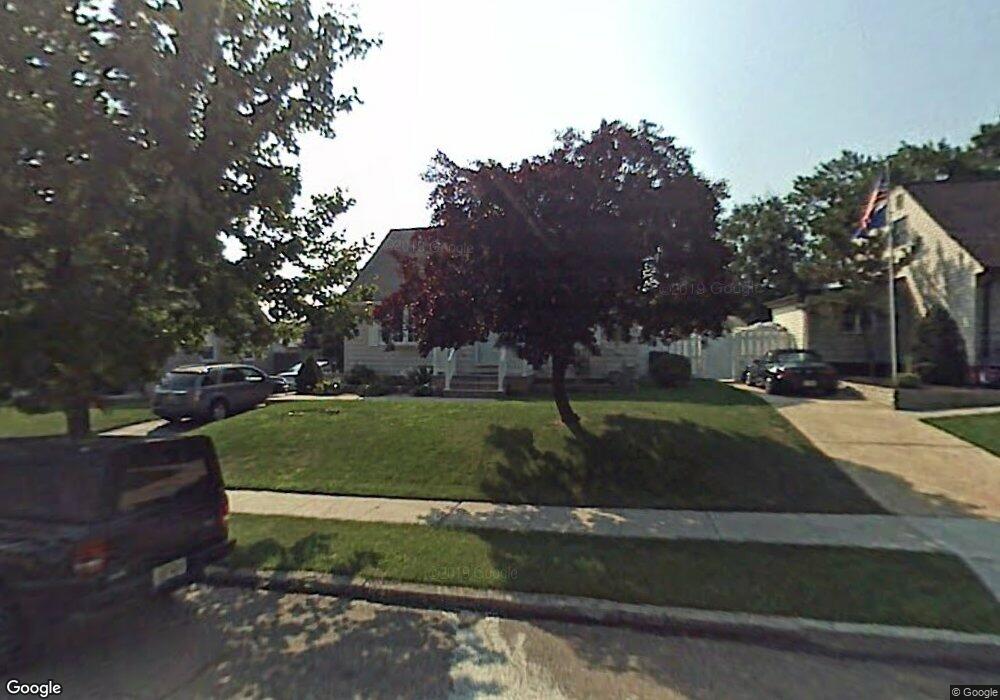
This home is located at 103 Johnson St, Fords, NJ 08863 and is currently estimated at $469,134, approximately $406 per square foot. 103 Johnson St is a home located in Middlesex County with nearby schools including Menlo Park Terrace School, Fords Middle School, and Woodbridge High School.
Ownership History
Date
Name
Owned For
Owner Type
Purchase Details
Closed on
Jan 29, 2016
Sold by
Goley Kenneth and Goley Jillian
Bought by
Calabrese Michael
Current Estimated Value
Home Financials for this Owner
Home Financials are based on the most recent Mortgage that was taken out on this home.
Original Mortgage
$237,405
Outstanding Balance
$189,378
Interest Rate
3.97%
Mortgage Type
New Conventional
Estimated Equity
$279,756
Purchase Details
Closed on
Apr 25, 1984
Bought by
Goley Kenneth and Goley Jillian
Create a Home Valuation Report for This Property
The Home Valuation Report is an in-depth analysis detailing your home's value as well as a comparison with similar homes in the area
Home Values in the Area
Average Home Value in this Area
Purchase History
| Date | Buyer | Sale Price | Title Company |
|---|---|---|---|
| Calabrese Michael | $249,900 | None Available | |
| Goley Kenneth | $30,000 | -- |
Source: Public Records
Mortgage History
| Date | Status | Borrower | Loan Amount |
|---|---|---|---|
| Open | Calabrese Michael | $237,405 |
Source: Public Records
Tax History Compared to Growth
Tax History
| Year | Tax Paid | Tax Assessment Tax Assessment Total Assessment is a certain percentage of the fair market value that is determined by local assessors to be the total taxable value of land and additions on the property. | Land | Improvement |
|---|---|---|---|---|
| 2025 | $8,121 | $64,000 | $24,400 | $39,600 |
| 2024 | $7,917 | $64,000 | $24,400 | $39,600 |
| 2023 | $7,917 | $64,000 | $24,400 | $39,600 |
| 2022 | $7,690 | $64,000 | $24,400 | $39,600 |
| 2021 | $7,421 | $64,000 | $24,400 | $39,600 |
| 2020 | $7,421 | $64,000 | $24,400 | $39,600 |
| 2019 | $7,242 | $64,000 | $24,400 | $39,600 |
| 2018 | $6,614 | $59,800 | $24,400 | $35,400 |
| 2017 | $6,491 | $59,800 | $24,400 | $35,400 |
| 2016 | $5,932 | $55,200 | $24,400 | $30,800 |
| 2015 | $5,825 | $55,200 | $24,400 | $30,800 |
| 2014 | $5,672 | $55,200 | $24,400 | $30,800 |
Source: Public Records
Map
Nearby Homes
- 99 Crestview Rd
- 111 Longview Cir
- 163 Winchester Rd
- 179 Liberty St
- 1 Olive St
- 450 Crows Mill Rd
- 164 Pennsylvania Ave
- 12 Liberty St
- 133 Howard St
- 7 Clum Ave
- 636 King Georges Rd
- 21 Douglas St
- 59 Douglas St
- 29 S Columbus Ave
- 10 Mary Ave
- 71 Pennsylvania Ave
- 16 Emmett Ave
- 134 Beech St
- 805 King Georges Rd
- 805 King George Rd