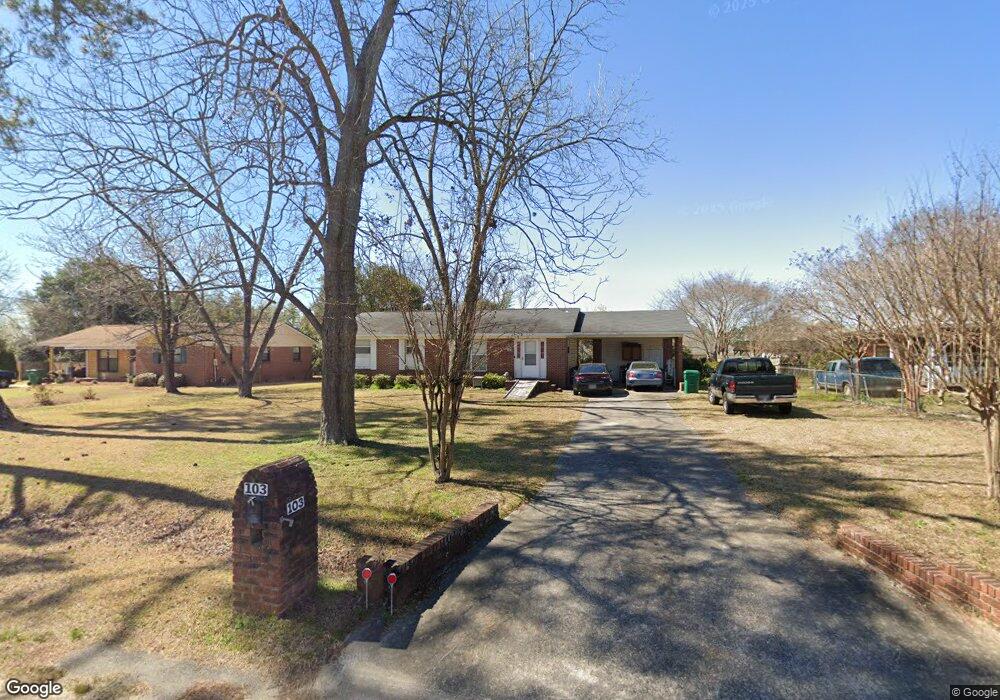
103 Juniper Rd Warner Robins, GA 31093
Estimated Value: $153,852 - $168,000
3
Beds
2
Baths
1,305
Sq Ft
$123/Sq Ft
Est. Value
About This Home
This home is located at 103 Juniper Rd, Warner Robins, GA 31093 and is currently estimated at $160,463, approximately $122 per square foot. 103 Juniper Rd is a home located in Houston County with nearby schools including Westside Elementary School, Northside Middle School, and Northside High School.
Ownership History
Date
Name
Owned For
Owner Type
Purchase Details
Closed on
Jun 12, 2006
Sold by
Delcid Tammy R
Bought by
Urbina Tammy and Urbina Melqui
Current Estimated Value
Home Financials for this Owner
Home Financials are based on the most recent Mortgage that was taken out on this home.
Original Mortgage
$71,200
Outstanding Balance
$4,654
Interest Rate
6.51%
Mortgage Type
New Conventional
Estimated Equity
$155,809
Purchase Details
Closed on
Dec 4, 2003
Sold by
Delcid Salvador A
Bought by
Delcid Tammy R
Purchase Details
Closed on
Jun 30, 2000
Sold by
Bevill Joe Thomas and Estelle O*
Bought by
Delcid Salvador A and Tammy R*
Purchase Details
Closed on
Feb 3, 2000
Sold by
Bevill Joe Thomas
Bought by
Bevill Joe Thomas and Estelle O*
Purchase Details
Closed on
Nov 18, 1981
Sold by
Bevil Joe Thomas
Bought by
Bevill Joe Thomas and Estelle O*
Purchase Details
Closed on
Aug 2, 1967
Sold by
Tower Inc
Bought by
Bevil Joe Thomas
Purchase Details
Closed on
Jul 16, 1964
Bought by
Tower Inc
Create a Home Valuation Report for This Property
The Home Valuation Report is an in-depth analysis detailing your home's value as well as a comparison with similar homes in the area
Home Values in the Area
Average Home Value in this Area
Purchase History
| Date | Buyer | Sale Price | Title Company |
|---|---|---|---|
| Urbina Tammy | -- | None Available | |
| Delcid Tammy R | -- | -- | |
| Delcid Salvador A | $56,000 | -- | |
| Bevill Joe Thomas | -- | -- | |
| Bevill Joe Thomas | -- | -- | |
| Bevil Joe Thomas | -- | -- | |
| Tower Inc | -- | -- |
Source: Public Records
Mortgage History
| Date | Status | Borrower | Loan Amount |
|---|---|---|---|
| Open | Urbina Tammy | $71,200 |
Source: Public Records
Tax History
| Year | Tax Paid | Tax Assessment Tax Assessment Total Assessment is a certain percentage of the fair market value that is determined by local assessors to be the total taxable value of land and additions on the property. | Land | Improvement |
|---|---|---|---|---|
| 2024 | $988 | $41,320 | $6,200 | $35,120 |
| 2023 | $839 | $34,720 | $6,200 | $28,520 |
| 2022 | $754 | $31,200 | $5,000 | $26,200 |
| 2021 | $672 | $27,640 | $5,000 | $22,640 |
| 2020 | $672 | $27,520 | $5,000 | $22,520 |
| 2019 | $672 | $27,520 | $5,000 | $22,520 |
| 2018 | $672 | $27,520 | $5,000 | $22,520 |
| 2017 | $672 | $27,520 | $5,000 | $22,520 |
| 2016 | $673 | $27,520 | $5,000 | $22,520 |
| 2015 | $675 | $27,520 | $5,000 | $22,520 |
| 2014 | -- | $27,520 | $5,000 | $22,520 |
| 2013 | -- | $27,520 | $5,000 | $22,520 |
Source: Public Records
Map
Nearby Homes
- 102 Hemlock St
- 110 Wray St
- 104 Heather St
- 3220 Mason Dr
- 101 Wray St
- 111 Hawthorne Rd
- 201 Eagles Landing Trail
- 221 Gilchrist Dr
- 110 Foxfire Dr
- 108 Madison Ave
- 123 Tanglewood Dr
- 102 Pine Glen Ct
- 218 Valencia Cir
- 112 Emory Dr
- 208 Pellimore Dr
- 202 Magnolia Glen
- 203 Gawin Dr
- 209 Knodishall Dr
- 117 Crestwood Ct
- 200 Collins Estate Ave
Your Personal Tour Guide
Ask me questions while you tour the home.