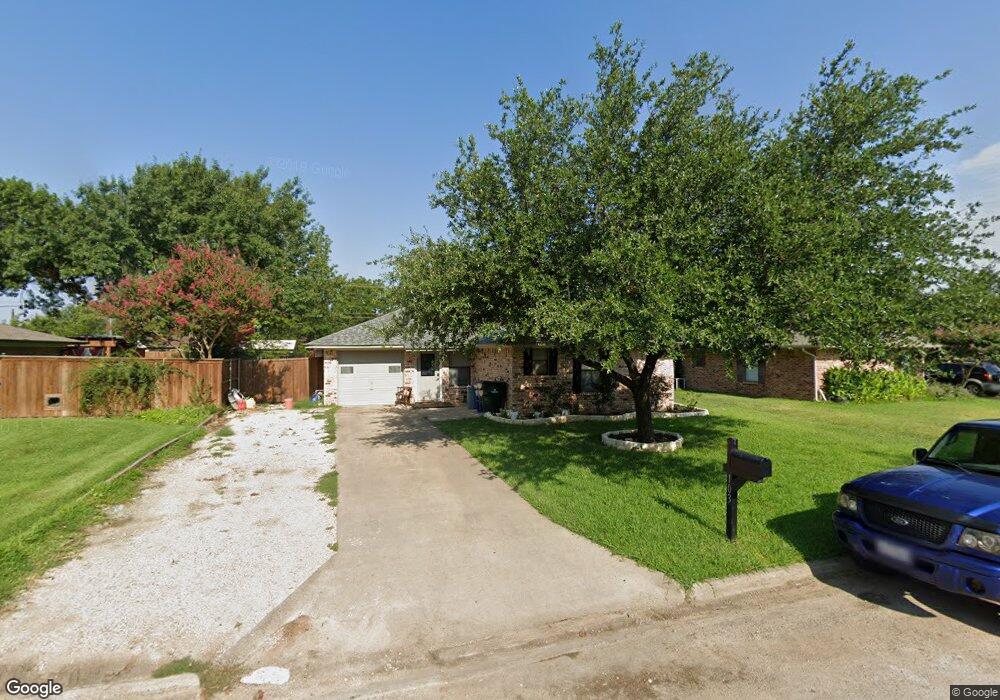
103 Kathryn Dr Sanger, TX 76266
Estimated Value: $205,522 - $241,000
3
Beds
2
Baths
1,056
Sq Ft
$212/Sq Ft
Est. Value
About This Home
This home is located at 103 Kathryn Dr, Sanger, TX 76266 and is currently estimated at $224,131, approximately $212 per square foot. 103 Kathryn Dr is a home located in Denton County with nearby schools including Chisholm Trail Elementary School, Clear Creek Intermediate School, and Sanger Sixth Grade Campus.
Ownership History
Date
Name
Owned For
Owner Type
Purchase Details
Closed on
Nov 7, 2013
Sold by
Stevenson Chad
Bought by
Hurst Amanda Y
Current Estimated Value
Home Financials for this Owner
Home Financials are based on the most recent Mortgage that was taken out on this home.
Original Mortgage
$91,836
Outstanding Balance
$68,865
Interest Rate
4.37%
Mortgage Type
New Conventional
Estimated Equity
$155,266
Purchase Details
Closed on
Jan 27, 2005
Sold by
Howard Clyde W and Howard Rachael
Bought by
Stevenson Chad
Home Financials for this Owner
Home Financials are based on the most recent Mortgage that was taken out on this home.
Original Mortgage
$84,671
Interest Rate
5.8%
Mortgage Type
FHA
Purchase Details
Closed on
Mar 8, 1999
Sold by
Farguson Jimmy L and Farguson Star E
Bought by
Hard Clyde W and Howard Rachael
Home Financials for this Owner
Home Financials are based on the most recent Mortgage that was taken out on this home.
Original Mortgage
$16,535
Interest Rate
6.73%
Create a Home Valuation Report for This Property
The Home Valuation Report is an in-depth analysis detailing your home's value as well as a comparison with similar homes in the area
Home Values in the Area
Average Home Value in this Area
Purchase History
| Date | Buyer | Sale Price | Title Company |
|---|---|---|---|
| Hurst Amanda Y | -- | None Available | |
| Stevenson Chad | -- | Reunion Title | |
| Hard Clyde W | -- | -- |
Source: Public Records
Mortgage History
| Date | Status | Borrower | Loan Amount |
|---|---|---|---|
| Open | Hurst Amanda Y | $91,836 | |
| Previous Owner | Stevenson Chad | $84,671 | |
| Previous Owner | Hard Clyde W | $16,535 |
Source: Public Records
Tax History Compared to Growth
Tax History
| Year | Tax Paid | Tax Assessment Tax Assessment Total Assessment is a certain percentage of the fair market value that is determined by local assessors to be the total taxable value of land and additions on the property. | Land | Improvement |
|---|---|---|---|---|
| 2025 | $2,594 | $189,827 | $59,850 | $129,977 |
| 2024 | $3,746 | $185,371 | $0 | $0 |
| 2023 | $2,258 | $168,519 | $59,850 | $176,512 |
| 2022 | $3,397 | $153,199 | $41,250 | $131,674 |
| 2021 | $2,927 | $139,272 | $41,250 | $98,022 |
| 2020 | $2,810 | $127,002 | $29,288 | $98,705 |
| 2019 | $2,629 | $115,457 | $29,288 | $100,679 |
| 2018 | $2,403 | $104,961 | $29,288 | $75,673 |
| 2017 | $2,277 | $99,000 | $28,050 | $70,950 |
| 2016 | $1,923 | $90,000 | $26,813 | $63,187 |
| 2015 | $1,719 | $83,253 | $26,813 | $56,440 |
| 2013 | -- | $81,374 | $26,813 | $54,561 |
Source: Public Records
Map
Nearby Homes
- 113 Diane Dr
- 109 Colonial Heights
- 505 Houston St
- 212 Diane Dr
- 319 Austin St
- 509 Marshall St
- 226 Hillcrest St
- 710 W Willow St
- 109 S 5th St
- 202 Southland Dr
- 209 Southland Dr
- 411 Hughes St
- 1010 Bolivar St
- 124 Morning Glory
- 1209 Bolivar St
- 185 Aster Dr
- 108 Magnolia Dr
- 106 W Holt St
- 130 Southside Dr
- 0000 Rector Rd