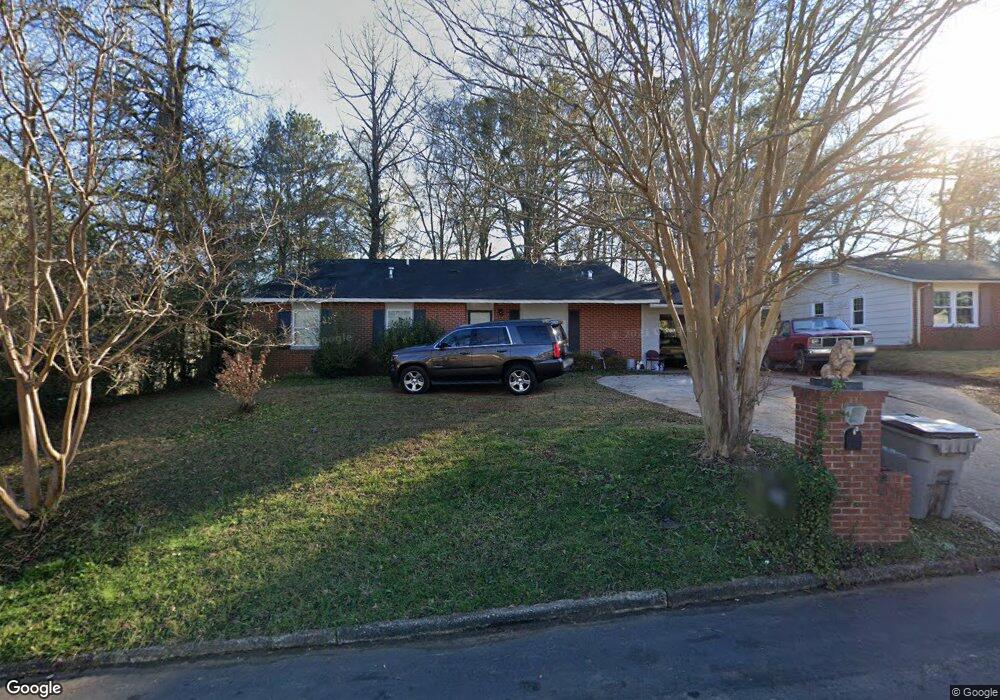
103 Lady Elaine Dr Lagrange, GA 30241
Estimated Value: $221,000 - $247,000
5
Beds
3
Baths
2,208
Sq Ft
$105/Sq Ft
Est. Value
About This Home
This home is located at 103 Lady Elaine Dr, Lagrange, GA 30241 and is currently estimated at $231,851, approximately $105 per square foot. 103 Lady Elaine Dr is a home located in Troup County with nearby schools including Callaway Elementary School, Hogansville Elementary School, and Callaway Middle School.
Ownership History
Date
Name
Owned For
Owner Type
Purchase Details
Closed on
Dec 16, 2010
Sold by
Donz Inc
Bought by
Brown Sherri D
Current Estimated Value
Home Financials for this Owner
Home Financials are based on the most recent Mortgage that was taken out on this home.
Original Mortgage
$82,845
Outstanding Balance
$54,818
Interest Rate
4.25%
Mortgage Type
FHA
Estimated Equity
$177,033
Purchase Details
Closed on
Jun 16, 2008
Sold by
The Bank Of New York
Bought by
Donz Inc
Purchase Details
Closed on
Mar 4, 2008
Sold by
Allen Dorothy Mae
Bought by
The Bank Of New York
Purchase Details
Closed on
Apr 30, 1987
Sold by
Paul M Patrick
Bought by
Dorothy Mae Allen
Purchase Details
Closed on
Jan 1, 1972
Sold by
Camelot Builders Inc
Bought by
Paul M Patrick
Purchase Details
Closed on
Jan 1, 1971
Sold by
Donald R Jenkins
Bought by
Camelot Builders Inc
Purchase Details
Closed on
Oct 24, 1968
Sold by
Mrs J T Whitaker
Bought by
Donald R Jenkins
Create a Home Valuation Report for This Property
The Home Valuation Report is an in-depth analysis detailing your home's value as well as a comparison with similar homes in the area
Home Values in the Area
Average Home Value in this Area
Purchase History
| Date | Buyer | Sale Price | Title Company |
|---|---|---|---|
| Brown Sherri D | $85,000 | -- | |
| Donz Inc | $39,700 | -- | |
| The Bank Of New York | -- | -- | |
| Dorothy Mae Allen | $42,500 | -- | |
| Paul M Patrick | -- | -- | |
| Camelot Builders Inc | -- | -- | |
| Donald R Jenkins | -- | -- |
Source: Public Records
Mortgage History
| Date | Status | Borrower | Loan Amount |
|---|---|---|---|
| Open | Brown Sherri D | $82,845 |
Source: Public Records
Tax History Compared to Growth
Tax History
| Year | Tax Paid | Tax Assessment Tax Assessment Total Assessment is a certain percentage of the fair market value that is determined by local assessors to be the total taxable value of land and additions on the property. | Land | Improvement |
|---|---|---|---|---|
| 2024 | $1,841 | $67,520 | $10,000 | $57,520 |
| 2023 | $1,680 | $61,600 | $10,000 | $51,600 |
| 2022 | $1,432 | $51,320 | $5,040 | $46,280 |
| 2021 | $1,129 | $37,440 | $4,200 | $33,240 |
| 2020 | $1,129 | $37,440 | $4,200 | $33,240 |
| 2019 | $1,048 | $34,760 | $4,200 | $30,560 |
| 2018 | $1,047 | $34,710 | $4,150 | $30,560 |
| 2017 | $1,047 | $34,710 | $4,150 | $30,560 |
| 2016 | $1,015 | $33,644 | $4,150 | $29,494 |
| 2015 | $1,018 | $33,686 | $4,192 | $29,494 |
| 2014 | $972 | $32,134 | $4,192 | $27,942 |
| 2013 | -- | $32,870 | $4,192 | $28,678 |
Source: Public Records
Map
Nearby Homes
- 719 Windstream Dr Unit B61
- 719 Windstream Dr
- 721 Windstream Dr Unit B62
- Hemingway Plan at Crossvine Village
- Mira Plan at Crossvine Village
- Cecil Plan at Crossvine Village
- Tucker FP Plan at Crossvine Village
- Sierra Plan at Crossvine Village
- Jodeco FP Plan at Crossvine Village
- Nottely Plan at Crossvine Village
- Carter Plan at Crossvine Village
- Winston Plan at Crossvine Village
- Nelson Plan at Crossvine Village
- Madison Plan at Crossvine Village
- 206 Freshwater Ct Unit 34E
- 206 Freshwater Ct
- 204 Freshwater Ct
- 204 Freshwater Ct Unit 35E
- 124 Shenandoah Ln
- 128 Shenandoah Ln Unit A67
- 105 Lady Elaine Dr
- 101 King Arthur Dr
- 107 Lady Elaine Dr
- 100 Lady Elaine Dr
- 102 Lady Elaine Dr
- 104 Lady Elaine St
- 104 Lady Elaine Dr
- 104 Lady Elaine Dr Unit 31
- 109 Lady Elaine Dr
- 100 King Arthur Dr
- 106 King Arthur Dr
- 109 King Arthur Dr
- 1409 Hogansville Rd
- 102 Sir Lancelot St
- 108 King Arthur Dr
- 101 Sir Lancelot St
- 111 King Arthur Dr
- 0 King Arthur Dr Unit 8330282
- 0 King Arthur Dr Unit 7364205
- 0 King Arthur Dr Unit 7457062