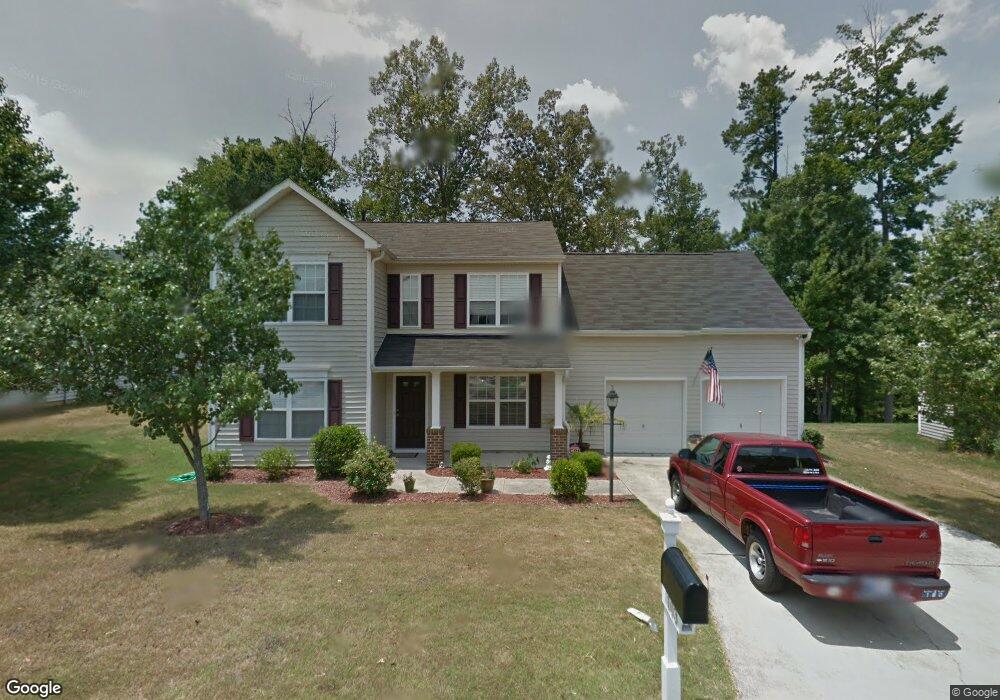
103 Lanier Valley Dr Durham, NC 27703
Eastern Durham NeighborhoodEstimated Value: $395,000 - $423,000
3
Beds
3
Baths
1,988
Sq Ft
$203/Sq Ft
Est. Value
About This Home
This home is located at 103 Lanier Valley Dr, Durham, NC 27703 and is currently estimated at $403,179, approximately $202 per square foot. 103 Lanier Valley Dr is a home located in Durham County with nearby schools including Oak Grove Elementary, John W Neal Middle School, and Southern School of Energy & Sustainability.
Ownership History
Date
Name
Owned For
Owner Type
Purchase Details
Closed on
Jun 20, 2014
Sold by
Binske John and Binske Tina
Bought by
Raudsep Johannes and Raudsep Linda Astrid
Current Estimated Value
Purchase Details
Closed on
Jul 28, 2010
Sold by
Anderson Dwayne and Anderson Natasha
Bought by
Binske John and Binske Tina
Home Financials for this Owner
Home Financials are based on the most recent Mortgage that was taken out on this home.
Original Mortgage
$197,149
Interest Rate
4.74%
Mortgage Type
VA
Purchase Details
Closed on
Dec 20, 2002
Sold by
D R Horton Inc Torrey
Bought by
Anderson Dwayne and Anderson Natasha
Home Financials for this Owner
Home Financials are based on the most recent Mortgage that was taken out on this home.
Original Mortgage
$172,458
Interest Rate
6.07%
Mortgage Type
FHA
Create a Home Valuation Report for This Property
The Home Valuation Report is an in-depth analysis detailing your home's value as well as a comparison with similar homes in the area
Home Values in the Area
Average Home Value in this Area
Purchase History
We collect this data history from publicly available records. To have your information removed, we recommend requesting removal directly through your county’s website.
| Date | Buyer | Sale Price | Title Company |
|---|---|---|---|
| Raudsep Johannes | $187,500 | None Available | |
| Binske John | $193,000 | None Available | |
| Anderson Dwayne | $175,500 | -- |
Source: Public Records
Mortgage History
We collect this data history from publicly available records. To have your information removed, we recommend requesting removal directly through your county’s website.
| Date | Status | Borrower | Loan Amount |
|---|---|---|---|
| Previous Owner | Binske John | $197,149 | |
| Previous Owner | Anderson Dwayne | $172,458 |
Source: Public Records
Tax History
| Year | Tax Paid | Tax Assessment Tax Assessment Total Assessment is a certain percentage of the fair market value that is determined by local assessors to be the total taxable value of land and additions on the property. | Land | Improvement |
|---|---|---|---|---|
| 2025 | $4,042 | $407,717 | $91,500 | $316,217 |
| 2024 | $3,082 | $220,967 | $45,637 | $175,330 |
| 2023 | $2,894 | $220,967 | $45,637 | $175,330 |
| 2022 | $2,828 | $220,967 | $45,637 | $175,330 |
| 2021 | $2,815 | $220,967 | $45,637 | $175,330 |
| 2020 | $2,749 | $220,967 | $45,637 | $175,330 |
| 2019 | $2,749 | $220,967 | $45,637 | $175,330 |
| 2018 | $2,564 | $189,021 | $42,595 | $146,426 |
| 2017 | $2,545 | $189,021 | $42,595 | $146,426 |
| 2016 | $2,459 | $189,021 | $42,595 | $146,426 |
| 2015 | $2,734 | $197,479 | $36,141 | $161,338 |
| 2014 | -- | $197,479 | $36,141 | $161,338 |
Source: Public Records
Map
Nearby Homes
- 112 Crosswood Dr
- 110 Kindlewood Dr
- 7 Autrey Mill Cir
- 6 Autrey Mill Cir
- 4121 Grove Ridge Dr
- 406 Robbins Rd
- 402 Robbins Rd
- 3804 Valleydale Dr
- 2800-2809 Napoli Dr
- 3804 Northlake Dr
- 15 N Indiancreek Place
- 6 Sugar Maple Ct
- 501 Guy Walker Way
- 450 Stallings Rd
- 5105 Hadrian Dr
- 6 Cayman Ct
- 312 Stallings Rd
- 304 Stallings Rd
- 901 Southshore Pkwy
- 210 Stallings Rd
- 514 Oak Grove Pkwy
- 602 Oak Grove Pkwy
- 512 Oak Grove Pkwy
- 104 Crosswood Dr
- 102 Crosswood Dr
- 604 Oak Grove Pkwy
- 106 Crosswood Dr
- 508 OAK GR To Be Added
- 508 OAK GROVE P To Be Added
- 508 Oak Grove Pkwy
- 101 Lanier Valley Dr
- 102 Lanier Valley Dr
- 108 Crosswood Dr
- 506 Oak Grove Pkwy
- 104 Lanier Valley Dr
- 103 Crosswood Dr
- 110 Crosswood Dr
- 12 Kimbrough Ct
- 105 Crosswood Dr
- 105 Lanier Valley Dr
Your Personal Tour Guide
Ask me questions while you tour the home.